 USE MATLAB:
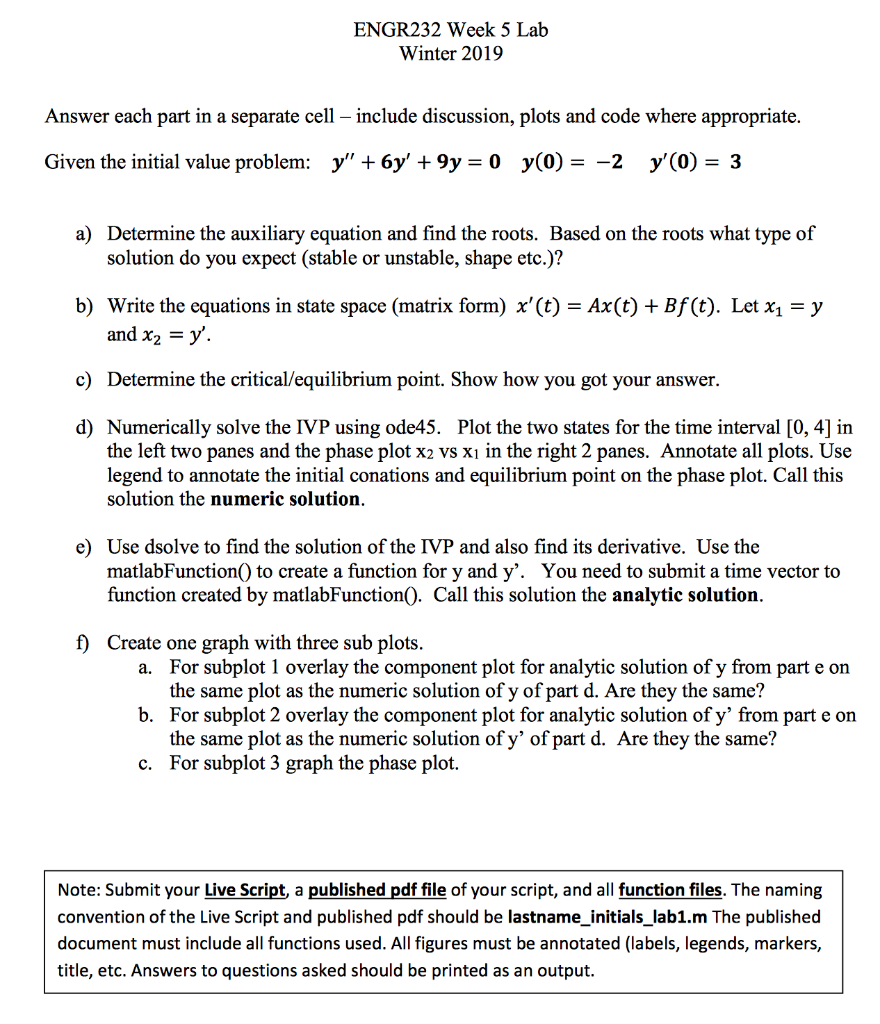
Answer each part in a separate cell include discussion, plots and code where appropriate.
Given the initial value problem: + + = () = () =
a) Determine the auxiliary equation and find the roots. Based on the roots what type of solution do you expect (stable or unstable, shape etc.)?
b) Write the equations in state space (matrix form) () = () + (). Let 1 = and 2 = .
c) Determine the critical/equilibrium point. Show how you got your answer.
d) Numerically solve the IVP using ode45. Plot the two states for the time interval [0, 4] in the left two panes and the phase plot x2 vs x1 in the right 2 panes. Annotate all plots. Use legend to annotate the initial conations and equilibrium point on the phase plot. Call this solution the numeric solution.
e) Use dsolve to find the solution of the IVP and also find its derivative. Use the matlabFunction() to create a function for y and y. You need to submit a time vector to function created by matlabFunction(). Call this solution the analytic solution.
f) Create one graph with three sub plots.
-
For subplot 1 overlay the component plot for analytic solution of y from part e on the same plot as the numeric solution of y of part d. Are they the same?
-
For subplot 2 overlay the component plot for analytic solution of y from part e on the same plot as the numeric solution of y of part d. Are they the same?
-
For subplot 3 graph the phase plot.
ENGR232 Week 5 Lab Winter 2019 Answer each part in a separate cell - include discussion, plots and code where appropriate Given the initial value problem: y" +6y' +9y 0 y(0) -2 y'(0)-3 Determine the auxiliary equation and find the roots. Based on the roots what type of solution do you expect (stable or unstable, shape etc.)? a) b) Write the equations in state space (matrix form) x'(t) - Ax(t) + Bf (t). Let x1 -y and x2 - c) Determine the critical/equilibrium point. Show how you got your answer. d) Numerically solve the IVP using ode45. Plot the two states for the time interval [0, 4] in the left two panes and the phase plot x2 vs xi in the right 2 panes. Annotate all plots. Use legend to annotate the initial conations and equilibrium point on the phase plot. Call this solution the numeric solution e) Use dsolve to find the solution of the IVP and also find its derivative. Use the matlabFunction() to create a function for y and y'. You need to submit a time vector to function created by matlabFunction). Call this solution the analytic solution f) Create one graph with three sub plots For subplot 1 overlay the component plot for analytic solution of y from part e on the same plot as the numeric solution of y of part d. Are they the same? For subplot 2 overlay the component plot for analytic solution of y' from part e on the same plot as the numeric solution of y' of part d. Are they the same? For subplot 3 graph the phase plot. a. b. c. Note: Submit your Live Script, a published pdf file of your script, and all function files. The naming convention of the Live Script and published pdf should be lastname_initials_lab1.m The published document must include all functions used. All figures must be annotated (labels, legends, markers, title, etc. Answers to questions asked should be printed as an output ENGR232 Week 5 Lab Winter 2019 Answer each part in a separate cell - include discussion, plots and code where appropriate Given the initial value problem: y" +6y' +9y 0 y(0) -2 y'(0)-3 Determine the auxiliary equation and find the roots. Based on the roots what type of solution do you expect (stable or unstable, shape etc.)? a) b) Write the equations in state space (matrix form) x'(t) - Ax(t) + Bf (t). Let x1 -y and x2 - c) Determine the critical/equilibrium point. Show how you got your answer. d) Numerically solve the IVP using ode45. Plot the two states for the time interval [0, 4] in the left two panes and the phase plot x2 vs xi in the right 2 panes. Annotate all plots. Use legend to annotate the initial conations and equilibrium point on the phase plot. Call this solution the numeric solution e) Use dsolve to find the solution of the IVP and also find its derivative. Use the matlabFunction() to create a function for y and y'. You need to submit a time vector to function created by matlabFunction). Call this solution the analytic solution f) Create one graph with three sub plots For subplot 1 overlay the component plot for analytic solution of y from part e on the same plot as the numeric solution of y of part d. Are they the same? For subplot 2 overlay the component plot for analytic solution of y' from part e on the same plot as the numeric solution of y' of part d. Are they the same? For subplot 3 graph the phase plot. a. b. c. Note: Submit your Live Script, a published pdf file of your script, and all function files. The naming convention of the Live Script and published pdf should be lastname_initials_lab1.m The published document must include all functions used. All figures must be annotated (labels, legends, markers, title, etc. Answers to questions asked should be printed as an output