Question
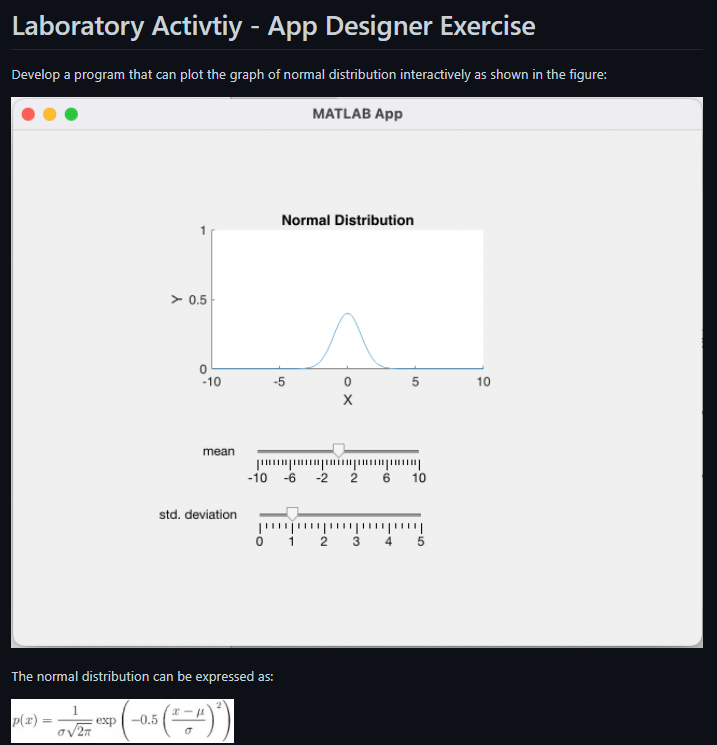
Use MATLAB AppDesigner Use this code template: classdef normalApp % Properties that correspond to app components properties (Access = public) UIFigure matlab.ui.Figure stddeviationSlider matlab.ui.control.Slider stddeviationSliderLabel
Use MATLAB AppDesigner


Use this code template:
classdef normalApp
% Properties that correspond to app components
properties (Access = public)
UIFigure matlab.ui.Figure
stddeviationSlider matlab.ui.control.Slider
stddeviationSliderLabel matlab.ui.control.Label
meanSlider matlab.ui.control.Slider
meanSliderLabel matlab.ui.control.Label
UIAxes matlab.ui.control.UIAxes
end
properties (Access = public)
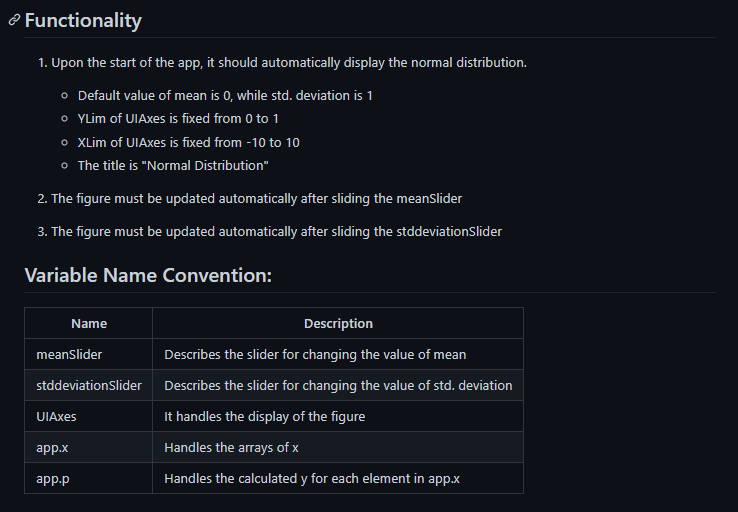
x % x-axis
p % calculated scores across each element of x
end
% Callbacks that handle component events
methods (Access = private)
% Code that executes after component creation
function startupFcn(app)
%Write your code here%
end
% Value changed function: meanSlider
function meanSliderValueChanged(app, event)
%Write your code here%
end
% Value changed function: stddeviationSlider
function stddeviationSliderValueChanged(app, event)
%Write your code here%
end
end
% Component initialization
methods (Access = private)
% Create UIFigure and components
function createComponents(app)
% Create UIFigure and hide until all components are created
app.UIFigure = uifigure('Visible', 'off');
app.UIFigure.Position = [100 100 640 480];
app.UIFigure.Name = 'MATLAB App';
% Create UIAxes
app.UIAxes = uiaxes(app.UIFigure);
title(app.UIAxes, 'Normal Distribution')
xlabel(app.UIAxes, 'X')
ylabel(app.UIAxes, 'Y')
zlabel(app.UIAxes, 'Z')
app.UIAxes.Position = [145 222 300 185];
% Create meanSliderLabel
app.meanSliderLabel = uilabel(app.UIFigure);
app.meanSliderLabel.HorizontalAlignment = 'right';
app.meanSliderLabel.Position = [172 171 35 22];
app.meanSliderLabel.Text = 'mean';
% Create meanSlider
app.meanSlider = uislider(app.UIFigure);
app.meanSlider.Limits = [-10 10];
app.meanSlider.ValueChangedFcn = createCallbackFcn(app, @meanSliderValueChanged, true);
app.meanSlider.Position = [228 180 150 3];
% Create stddeviationSliderLabel
app.stddeviationSliderLabel = uilabel(app.UIFigure);
app.stddeviationSliderLabel.HorizontalAlignment = 'right';
app.stddeviationSliderLabel.Position = [131 112 78 22];
app.stddeviationSliderLabel.Text = 'std. deviation';
% Create stddeviationSlider
app.stddeviationSlider = uislider(app.UIFigure);
app.stddeviationSlider.Limits = [0 5];
app.stddeviationSlider.ValueChangedFcn = createCallbackFcn(app, @stddeviationSliderValueChanged, true);
app.stddeviationSlider.Position = [230 121 150 3];
app.stddeviationSlider.Value = 1;
% Show the figure after all components are created
app.UIFigure.Visible = 'on';
end
end
% App creation and deletion
methods (Access = public)
% Construct app
function app = normalApp
% Create UIFigure and components
createComponents(app)
% Register the app with App Designer
registerApp(app, app.UIFigure)
% Execute the startup function
runStartupFcn(app, @startupFcn)
if nargout == 0
clear app
end
end
% Code that executes before app deletion
function delete(app)
% Delete UIFigure when app is deleted
delete(app.UIFigure)
end
end
end
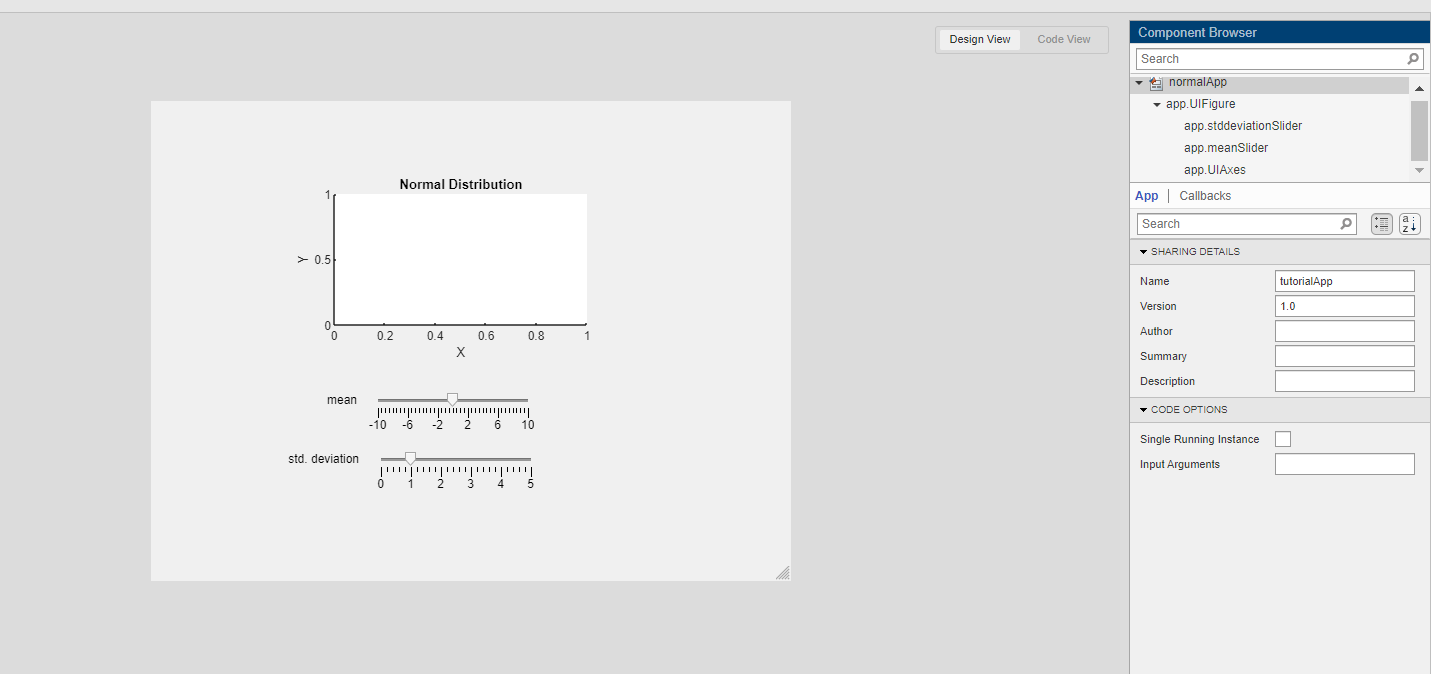
Design View:

Step by Step Solution
There are 3 Steps involved in it
Step: 1

Get Instant Access to Expert-Tailored Solutions
See step-by-step solutions with expert insights and AI powered tools for academic success
Step: 2

Step: 3

Ace Your Homework with AI
Get the answers you need in no time with our AI-driven, step-by-step assistance
Get Started


