Answered step by step
Verified Expert Solution
Link Copied!

Question

1 Approved Answer

Use Matlab code to answer the following questions. 1. DFT and plots of the function (a). Let g(x) = exp[-ra?r?] . a=1, plot continuous function

Use Matlab code to answer the following questions.image text in transcribed

1. DFT and plots of the function (a). Let g(x) = exp[-ra?r?] . a=1, plot continuous function g(x).- (b). Plot G(fy), the analytic Fourier transform of g(x). (c). Plot sampled function of g(x) + (d). Calculate and plot DFT of g(x). (e). Perform and discuss the above items at different sampling frequencies. 1. DFT and plots of the function (a). Let g(x) = exp[-ra?r?] . a=1, plot continuous function g(x).- (b). Plot G(fy), the analytic Fourier transform of g(x). (c). Plot sampled function of g(x) + (d). Calculate and plot DFT of g(x). (e). Perform and discuss the above items at different sampling frequencies

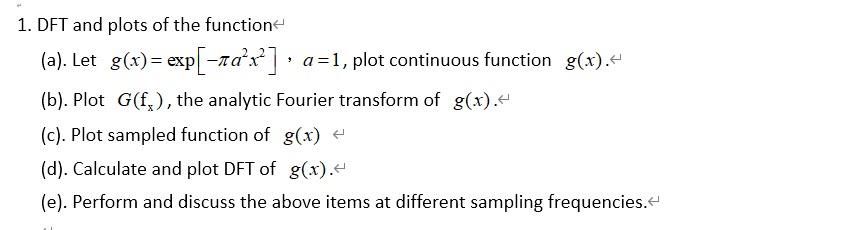
Step by Step Solution

There are 3 Steps involved in it

Step: 1

blur-text-image

Get Instant Access to Expert-Tailored Solutions

See step-by-step solutions with expert insights and AI powered tools for academic success

Step: 2

blur-text-image

Step: 3

blur-text-image

Ace Your Homework with AI

Get the answers you need in no time with our AI-driven, step-by-step assistance

Get Started

Recommended Textbook for

Oracle9i Database Administrator Implementation And Administration

Authors: Carol McCullough-Dieter

1st Edition

0619159006, 978-0619159009

More Books

Students also viewed these Databases questions