Answered step by step
Verified Expert Solution
Question
1 Approved Answer
Use MATLAB commands in your solutions unless otherwise specified. You WILL be graded on simplicity of your solution and the effective use of MATLAB

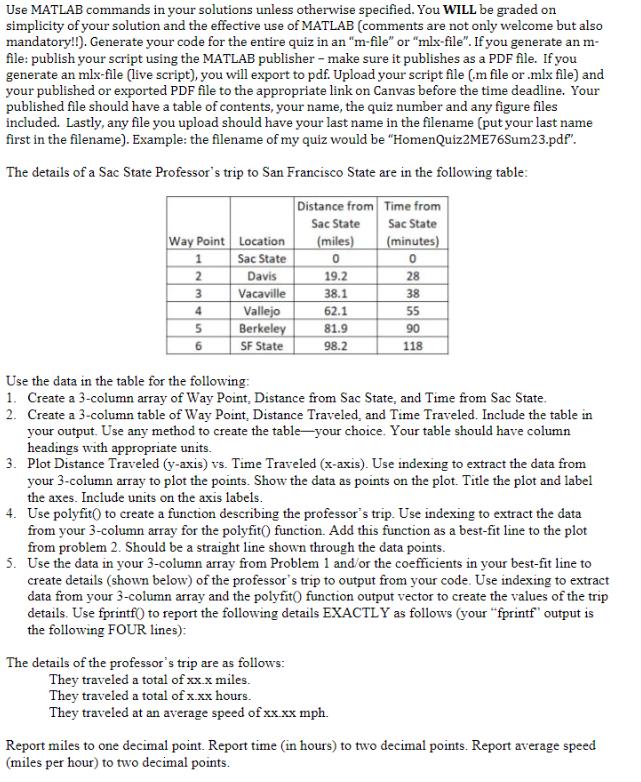
Use MATLAB commands in your solutions unless otherwise specified. You WILL be graded on simplicity of your solution and the effective use of MATLAB (comments are not only welcome but also mandatory!!). Generate your code for the entire quiz in an "m-file" or "mlx-file". If you generate an m- file: publish your script using the MATLAB publisher - make sure it publishes as a PDF file. If you generate an mlx-file (live script), you will export to pdf. Upload your script file (.m file or .mlx file) and your published or exported PDF file to the appropriate link on Canvas before the time deadline. Your published file should have a table of contents, your name, the quiz number and any figure files included. Lastly, any file you upload should have your last name in the filename (put your last name first in the filename). Example: the filename of my quiz would be "HomenQuiz2ME76Sum23.pdf". The details of a Sac State Professor's trip to San Francisco State are in the following table: Way Point Location Sac State 1 2 3 4 5 6 Davis Vacaville Vallejo Berkeley SF State Distance from Sac State (miles) 0 19.2 38.1 62.1 81.9 98.2 Time from Sac State (minutes) 0 28 38 The details of the professor's trip are as follows: They traveled a total of xx.x miles. They traveled a total of x.xx hours. They traveled at an average speed of xx.xx mph. 55 90 118 Use the data in the table for the following: 1. Create a 3-column array of Way Point, Distance from Sac State, and Time from Sac State. 2. Create a 3-column table of Way Point, Distance Traveled, and Time Traveled. Include the table in your output. Use any method to create the table-your choice. Your table should have column headings with appropriate units. 3. Plot Distance Traveled (y-axis) vs. Time Traveled (x-axis). Use indexing to extract the data from your 3-column array to plot the points. Show the data as points on the plot. Title the plot and label the axes. Include units on the axis labels. 4. Use polyfit() to create a function describing the professor's trip. Use indexing to extract the data from your 3-column array for the polyfit() function. Add this function as a best-fit line to the plot from problem 2. Should be a straight line shown through the data points. 5. Use the data in your 3-column array from Problem 1 and/or the coefficients in your best-fit line to create details (shown below) of the professor's trip to output from your code. Use indexing to extract data from your 3-column array and the polyfit() function output vector to create the values of the trip details. Use fprintf() to report the following details EXACTLY as follows (your "fprintf" output is the following FOUR lines): Report miles to one decimal point. Report time (in hours) to two decimal points. Report average speed (miles per hour) to two decimal points.
Step by Step Solution
★★★★★
3.28 Rating (145 Votes )
There are 3 Steps involved in it
Step: 1
First we need to create a 3column array of Way Point Distance from Sac State ...
Get Instant Access to Expert-Tailored Solutions
See step-by-step solutions with expert insights and AI powered tools for academic success
Step: 2

Step: 3

Ace Your Homework with AI
Get the answers you need in no time with our AI-driven, step-by-step assistance
Get Started


