

Answered step by step
Verified Expert Solution
Question
1 Approved Answer
Use MatLab Please. Do Question 5 Please. In the case above, you may have been able to continually guess values until you got close enough
Use MatLab Please. Do Question Please. In the case above, you may have been able to continually guess values until you got close
enough to the solution, becanse the velocity depends fairly predictably on However, when
there are more parameters involved, it can be hard, if not imposible, to gucsis the parameters.
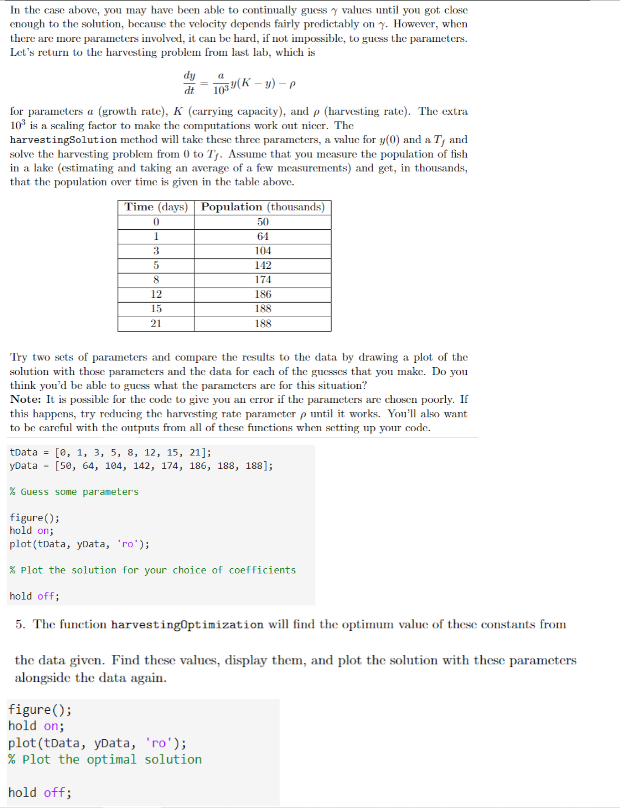
Let's return to the harvesting problem from last lab, which is
for parameters growth ratecarrying capacity and harvesting rate The extra
is a scaling factor to make the computations work out nicer. The
harvestingSolution method will take these three parameters, a value for and a and
solve the harvesting problem from to ssume that you measure the population of fish
in a lake estimating and taking an average of a few measurements and get, in thousands,
that the population over time is given in the table above.
Try two sets of parameters and compare the results to the data by drawing a plot of the
solution with those parameters and the data for each of the gucsses that you make. Do you
think you'd be able to guess what the parameters are for this situation?
Note: It is possible for the code to give you an error if the parameters are chosen poorly. If
this happens, try reducing the harvesting rate parameter until it works. You'll also want
to be careful with the outputs from all of these functions when setting up your code.
tData ;
yData ;
Guess some parameter's
figure;
hold on;
plottData yData, ;
Plot the solution for your choice of coefficients
hold off;
The function harvestingOptimization will find the optimum value of these constants from
the data given. Find these values, display them, and plot the solution with these parameters
alongside the data again.
figure;
hold on;
plottData yData, ro;
Plot the optimal solution
hold off;
Step by Step Solution
There are 3 Steps involved in it
Step: 1

Get Instant Access to Expert-Tailored Solutions
See step-by-step solutions with expert insights and AI powered tools for academic success
Step: 2

Step: 3
Ace Your Homework with AI
Get the answers you need in no time with our AI-driven, step-by-step assistance
Get Started
Oracle Database 12c Dba Handbook Manage A Scalable Secure Oracle Enterprise Database Environment
Authors: Bob Bryla
1st Edition
0071798781, 978-0071798785