Answered step by step
Verified Expert Solution
Link Copied!

Question

1 Approved Answer

Use Matlab The following data describes a series of density measurements collected at a range of temperatures. Using the subplot function, show the resulting plots

Use Matlab

image text in transcribed

The following data describes a series of density measurements collected at a range of temperatures. Using the subplot function, show the resulting plots for linear, spline, nearest, and pchip interpolation. For this dataset, what would you recommend

Step by Step Solution

There are 3 Steps involved in it

Step: 1

blur-text-image

Get Instant Access to Expert-Tailored Solutions

See step-by-step solutions with expert insights and AI powered tools for academic success

Step: 2

blur-text-image

Step: 3

blur-text-image

Ace Your Homework with AI

Get the answers you need in no time with our AI-driven, step-by-step assistance

Get Started

Recommended Textbook for

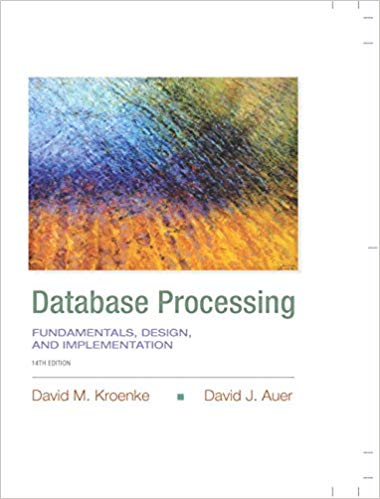
Database Processing Fundamentals, Design, and Implementation

Authors: David M. Kroenke, David J. Auer

14th edition

133876705, 9781292107639, 1292107634, 978-0133876703

More Books

Students also viewed these Databases questions

Question

What is the basis for Security Concerns in Cloud Computing?

Answered: 1 week ago

Question

Describe the three main Cloud Computing Environments.

Answered: 1 week ago