

Answered step by step
Verified Expert Solution
Question
1 Approved Answer
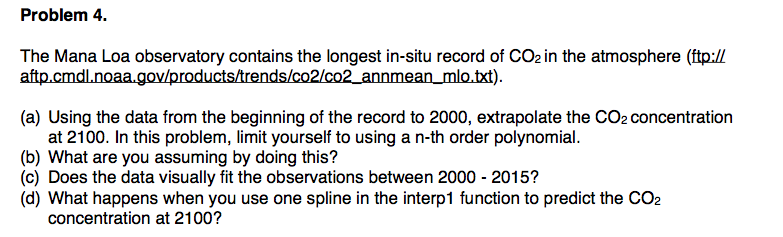
Use Matlab The Mana Loa observatory contains the longest in-situ record of CO_2 in the atmosphere (ftp://CO aftp.cmdl.noaa.gov/products/trends/co2/co2_annmean_mlo.txt.) (a) Using the data from the beginning
Use Matlab
Step by Step Solution
There are 3 Steps involved in it
Step: 1

Get Instant Access to Expert-Tailored Solutions
See step-by-step solutions with expert insights and AI powered tools for academic success
Step: 2

Step: 3
Ace Your Homework with AI
Get the answers you need in no time with our AI-driven, step-by-step assistance
Get Started
How To Build A Million Dollar Database
Authors: Michelle Bergquist
1st Edition
0615246842, 978-0615246840