

Question
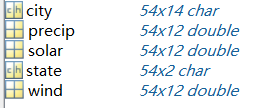
Use MATLAB to plot a table Given a database with the name of 54 citys, and their solar energy, preciptation, and wind speed of twelve
Use MATLAB to plot a table
Given a database with the name of 54 citys, and their solar energy, preciptation, and wind speed of twelve months(ignore the state)
the data is in this google drive link:https://drive.google.com/open?id=0B5h9dD4UrVkyV1RfbEIwLVNmZms
city is the name of 54 cities, precip,solar,and wind are for 12 months, just sum(solar,2) to get the annual amount and then sort.
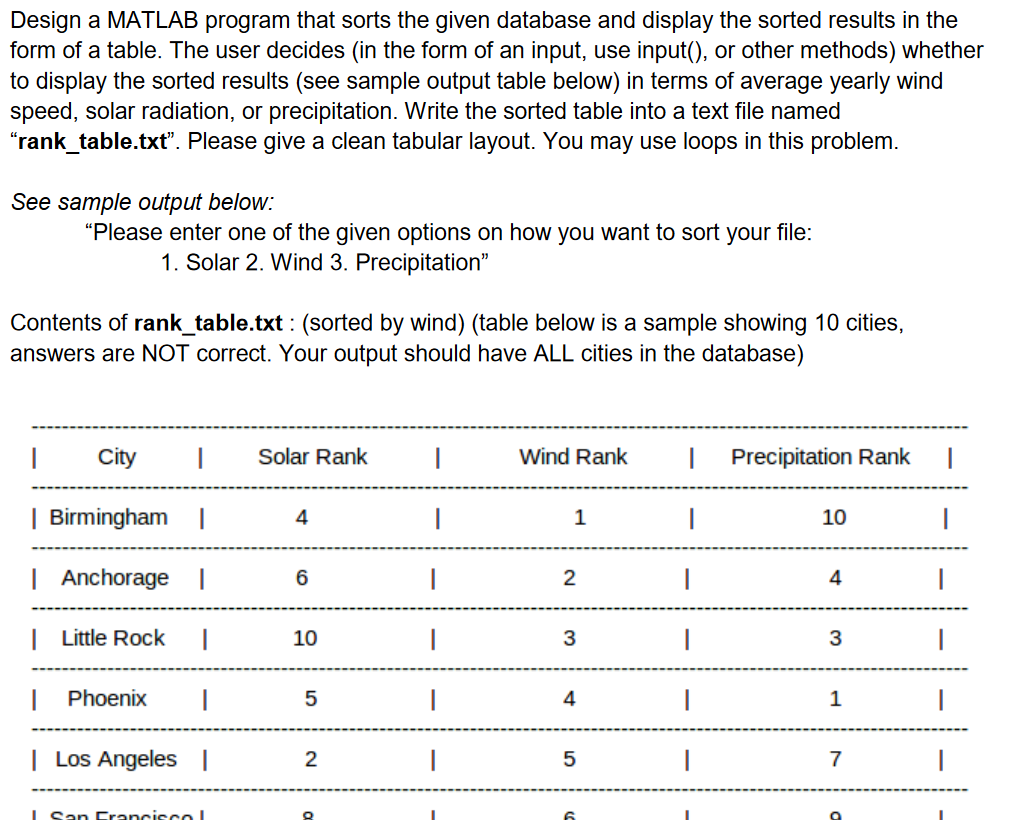
the problem is as followed
Step by Step Solution
There are 3 Steps involved in it
Step: 1

Get Instant Access to Expert-Tailored Solutions
See step-by-step solutions with expert insights and AI powered tools for academic success
Step: 2

Step: 3
Ace Your Homework with AI
Get the answers you need in no time with our AI-driven, step-by-step assistance
Get Started
Fundamentals Of Database System
Authors: Elmasri Ramez And Navathe Shamkant
7th Edition
978-9332582705