

Answered step by step
Verified Expert Solution
Question
1 Approved Answer
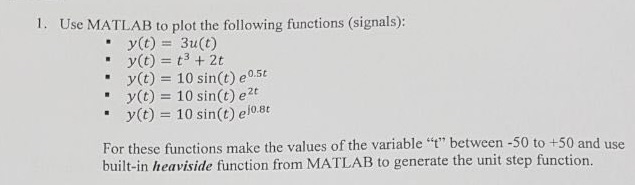
Use MATLAB to plot the following functions (signals): y(t) = 3u(t) y(t) = t^3 + 2t y(t) = 10 sin(t) e^0.5t y (t) = 10
Step by Step Solution
There are 3 Steps involved in it
Step: 1

Get Instant Access to Expert-Tailored Solutions
See step-by-step solutions with expert insights and AI powered tools for academic success
Step: 2

Step: 3
Ace Your Homework with AI
Get the answers you need in no time with our AI-driven, step-by-step assistance
Get Started
Oracle PL/SQL Programming Database Management Systems
Authors: Steven Feuerstein
1st Edition
978-1565921429