Answered step by step
Verified Expert Solution
Link Copied!

Question

1 Approved Answer

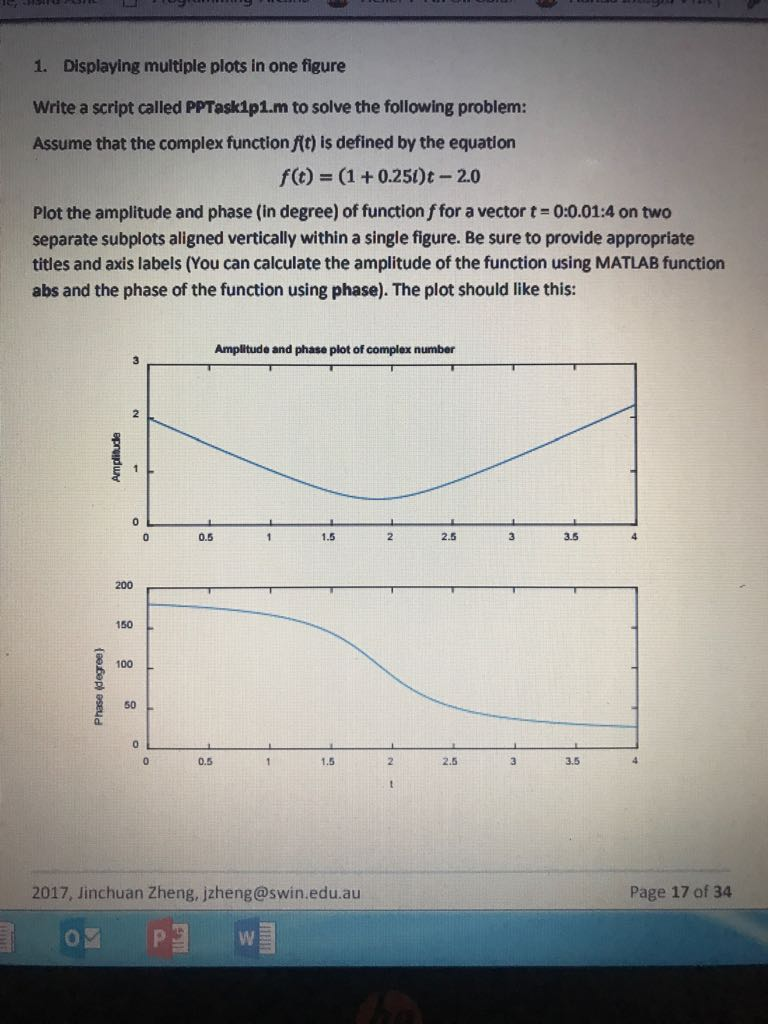
Use matlab to solve 1. Displaying multiple plots in one figure Write a script called PPTaskip1.m to solve the following problem: Assume that the complex

Use matlab to solve

image text in transcribed

1. Displaying multiple plots in one figure Write a script called PPTaskip1.m to solve the following problem: Assume that the complex function fIt) is defined by the equation f (t) (1 +0.250)t-2.0 Plot the amplitude and phase (in degree) of function f for a vector t 0:0.01:4 on two separate subplots aligned vertically within a single figure. Be sure to provide appropriate titles and axis labels (You can calculate the amplitude of the function using MATLAB function abs and the phase of the function using phase). The plot should like this: Amplitude and phase plot of complex number 0 0.5 1.5 2.5 3.5 200 50 100 50 0.5 1,5 2.5 3.5 2017, Jinchuan Zheng, jzheng@swin.edu.au Page 17 of 34

Step by Step Solution

There are 3 Steps involved in it

Step: 1

blur-text-image

Get Instant Access to Expert-Tailored Solutions

See step-by-step solutions with expert insights and AI powered tools for academic success

Step: 2

blur-text-image

Step: 3

blur-text-image

Ace Your Homework with AI

Get the answers you need in no time with our AI-driven, step-by-step assistance

Get Started

Recommended Textbook for

Flash XML Applications Use AS2 And AS3 To Create Photo Galleries Menus And Databases

Authors: Joachim Schnier

1st Edition

0240809173, 978-0240809175

More Books

Students also viewed these Databases questions