

Answered step by step
Verified Expert Solution
Question
1 Approved Answer
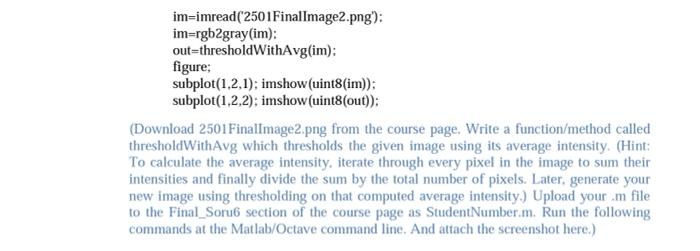
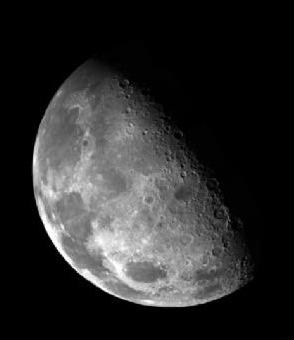
**use matlap or octave im=imread (2501 FinalImage2.png); im=rgb2gray(im): out=threshold WithAvg(im): figure; subplot(1,2,1); imshow (uint8(im)): subplot(1,2,2); imshow (uint8(out)): (Download 2501 Finallmage2.png from the course page. Write
**use matlap or octave
im=imread (2501 FinalImage2.png); im=rgb2gray(im): out=threshold WithAvg(im): figure; subplot(1,2,1); imshow (uint8(im)): subplot(1,2,2); imshow (uint8(out)): (Download 2501 Finallmage2.png from the course page. Write a function/method called thresholdWithAvg which thresholds the given image using its average intensity. (Hint: To calculate the average intensity. iterate through every pixel in the image to sum their intensities and finally divide the sum by the total number of pixels. Later, generate your new image using thresholding on that computed average intensity) Upload your .m file to the Final_Soru6 section of the course page as StudentNumber.m. Run the following commands at the Matlab/Octave command line. And attach the screenshot here.) Step by Step Solution
There are 3 Steps involved in it
Step: 1

Get Instant Access to Expert-Tailored Solutions
See step-by-step solutions with expert insights and AI powered tools for academic success
Step: 2

Step: 3
Ace Your Homework with AI
Get the answers you need in no time with our AI-driven, step-by-step assistance
Get Started
Practical Database Programming With Visual Basic.NET
Authors: Ying Bai
1st Edition
0521712351, 978-0521712354