Answered step by step
Verified Expert Solution
Question
1 Approved Answer
use minitab program. Use Minitab to answer the following questions, Remember, Minitab instructions may be found in the back of your purple course packet. Datasets


use minitab program.
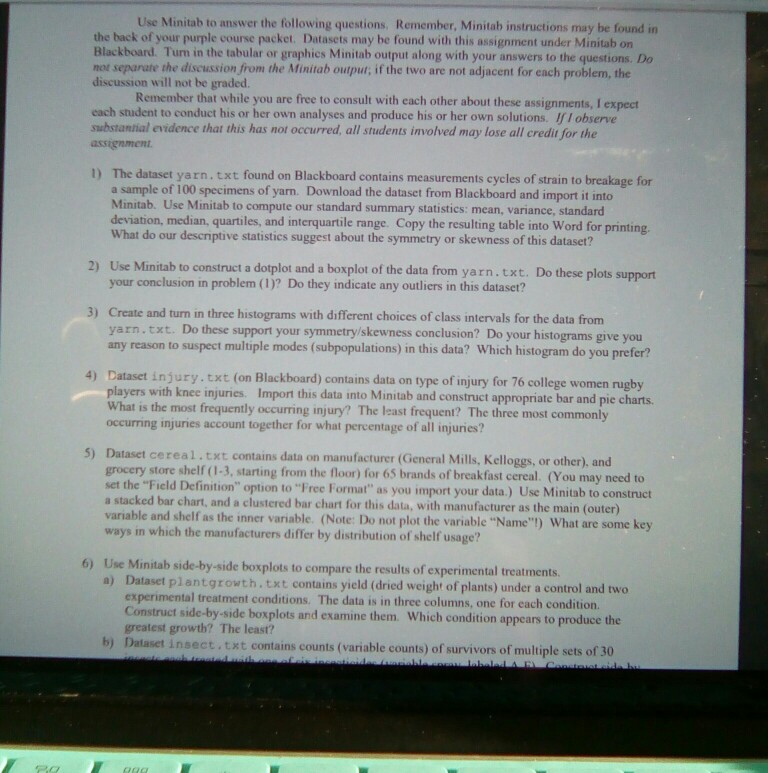
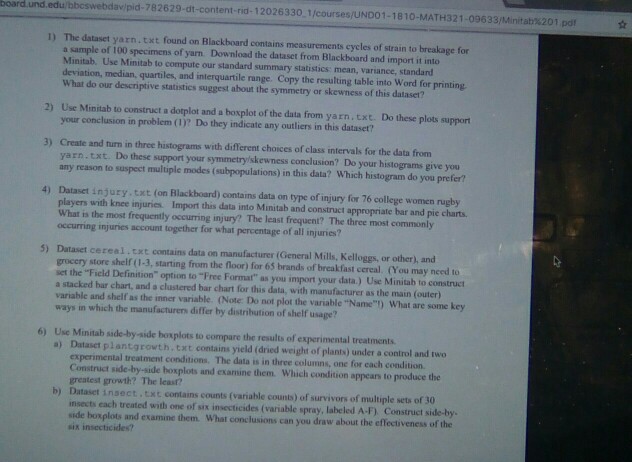
Use Minitab to answer the following questions, Remember, Minitab instructions may be found in the back of your purple course packet. Datasets may be found with this assignment under Minitab on Blackboard. Tun in the tabular or graphics Minitab output along with your answers to the questions. Do not separate the discussion from the Minitab output, if the two are not adjacent for each problem, the discussion will not be graded. Remember that while you are free to consult with each other about these assignments, I expedct each student to conduct his or her own analyses and produce his or her own solutions. I I observe substantial evidence that this has not occurred, all students involved may lose all credit for the ) The dataset yarn.txt found on Blackboard contains measurements cycles of strain to breakage for a sample of 100 specimens of yarn. Download the dataset from Blackboard and import it into Minitab. Use Minitab to compute our standard summary statistics: mean, variance, standard deviation, median, quartiles, and interquartile range. Copy the resulting table into Word for printing What do our descriptive statistics suggest about the symmetry or skewness of this dataset? 2) Use Minitab to construct a dotplot and a boxplot of the data from yarn.txt. Do these plots su your conclusion problem ( 1 )? Do they indicate any outliers in this dataset? 3) Create and turn in three histograms with different choices of class intervals for the data from arn.txt. Do these support your symmetry/skewness conclusion? Do your hist any reason to suspect multiple modes (subpopulations) in this data? Which histogram do you prefer? histograms give you Dataset injury.txt (on Blackboard) contains data on type of injury for 76 college women rugby players with knee injuries. Import this data into Minitab and construct appropriate bar and pie charts What is the most frequently occurring injury? The least frequent? The three most commonly occurring injuries account together for what percentage of all injuries? 4) 5) Dataset cereal.txt contains data on manufacturer (Gencral Mills, Kelloggs, or other), and grocery store shelf (1-3, starting from the floor) for 65 brands of breakfast cereal. (You may need to finition" option to "Free Format" as you import your data.) Use Minitab to construct a stacked bar chart, and a clustered bar chart for this data, with manufacturer as the main (outer) variable and shelf as the inner variable. (Note: Do not plot the variable "Name") What are some key ways in which the manufacturers differ by distribution of shelf usage? 6) Use Minitab side-by-side boxplots to compare the results of experimental treatments a) Dataset plantgrowth.txt contains yield (dried weight of plants) under a control and two experimental treatment conditions. The data is in three columns, one for each condition. Construct side-by-side boxplots and examine them. Which condition appears to produce the greatest growth? The least? Dataset insect.txt contains counts (variable counts) of survivors of multiple sets of 30 b)Step by Step Solution
There are 3 Steps involved in it
Step: 1

Get Instant Access to Expert-Tailored Solutions
See step-by-step solutions with expert insights and AI powered tools for academic success
Step: 2

Step: 3

Ace Your Homework with AI
Get the answers you need in no time with our AI-driven, step-by-step assistance
Get Started


