Answered step by step
Verified Expert Solution
Link Copied!

Question

1 Approved Answer

Use Newtons interpolating polynomial to determine ln(x) at x = 2. Compute the finite divided differences as shown in the table presented in class. Show

Use Newtons interpolating polynomial to determine ln(x) at x = 2. Compute the finite divided differences as shown in the table presented in class. Show the coefficients for polynomials of first (f1(x)), second (f2(x)), and third (f3(x)) order. Plot the interpolating polynomials and the function ln(x) in the interval [0, 8]. The data points used in the interpolation are given by x 1 4 6 5 ln(x) 0.000000 1.386294 1.791759 1.609438 In the same plot, represent the data points (x1, ln x1), ...,(x4, ln x4) using markers (circles). Add a legend to your plot. A short report (2 pages max) showing calculations, the code used to create the plot and/or to calculate the polynomial coefficients, and the plot is due in class. USE MATLAB CODEimage text in transcribed

Use Newton's interpolating polynomial to determine In( at 2. Compute the finite divided differences as shown in the table presented in class. Show the coefficients for polynomials of first (fi(r), second (f2(x, and third (fs(x)) order. Plot the interpolating polynomials and the function In(x) in the interval 0, 8]. The data points used in the interpolation are given 5 In 0.000000 1.386294 1.791759 1.609438 4 6 In the same plot, represent the data points (i, Inri) your plot. (, In r4) using markers (circles). Add a legend to A short report (2 pages max) showing calculations, the code used to create the plot and/or to calculate the polynomial coefficients, and the plot is due in class Use Newton's interpolating polynomial to determine In( at 2. Compute the finite divided differences as shown in the table presented in class. Show the coefficients for polynomials of first (fi(r), second (f2(x, and third (fs(x)) order. Plot the interpolating polynomials and the function In(x) in the interval 0, 8]. The data points used in the interpolation are given 5 In 0.000000 1.386294 1.791759 1.609438 4 6 In the same plot, represent the data points (i, Inri) your plot. (, In r4) using markers (circles). Add a legend to A short report (2 pages max) showing calculations, the code used to create the plot and/or to calculate the polynomial coefficients, and the plot is due in class

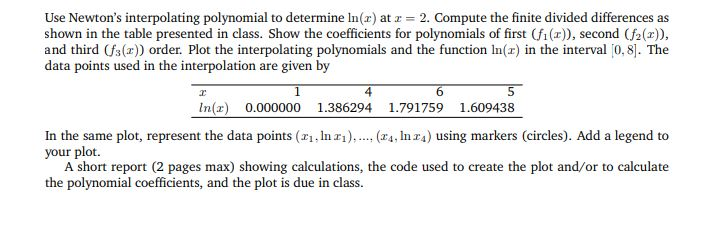
Step by Step Solution

There are 3 Steps involved in it

Step: 1

blur-text-image

Get Instant Access to Expert-Tailored Solutions

See step-by-step solutions with expert insights and AI powered tools for academic success

Step: 2

blur-text-image

Step: 3

blur-text-image

Ace Your Homework with AI

Get the answers you need in no time with our AI-driven, step-by-step assistance

Get Started

Recommended Textbook for

Current Trends In Database Technology Edbt 2006 Edbt 2006 Workshops Phd Datax Iidb Iiha Icsnw Qlqp Pim Parma And Reactivity On The Web Munich Germany March 2006 Revised Selected Papers Lncs 4254

Authors: Torsten Grust ,Hagen Hopfner ,Arantza Illarramendi ,Stefan Jablonski ,Marco Mesiti ,Sascha Muller ,Paula-Lavinia Patranjan ,Kai-Uwe Sattler ,Myra Spiliopoulou ,Jef Wijsen

2006th Edition

3540467882, 978-3540467885

More Books

Students also viewed these Databases questions

Question

8-6 Who poses the biggest security threat: insiders or outsiders?

Answered: 1 week ago