Answered step by step
Verified Expert Solution
Question
1 Approved Answer
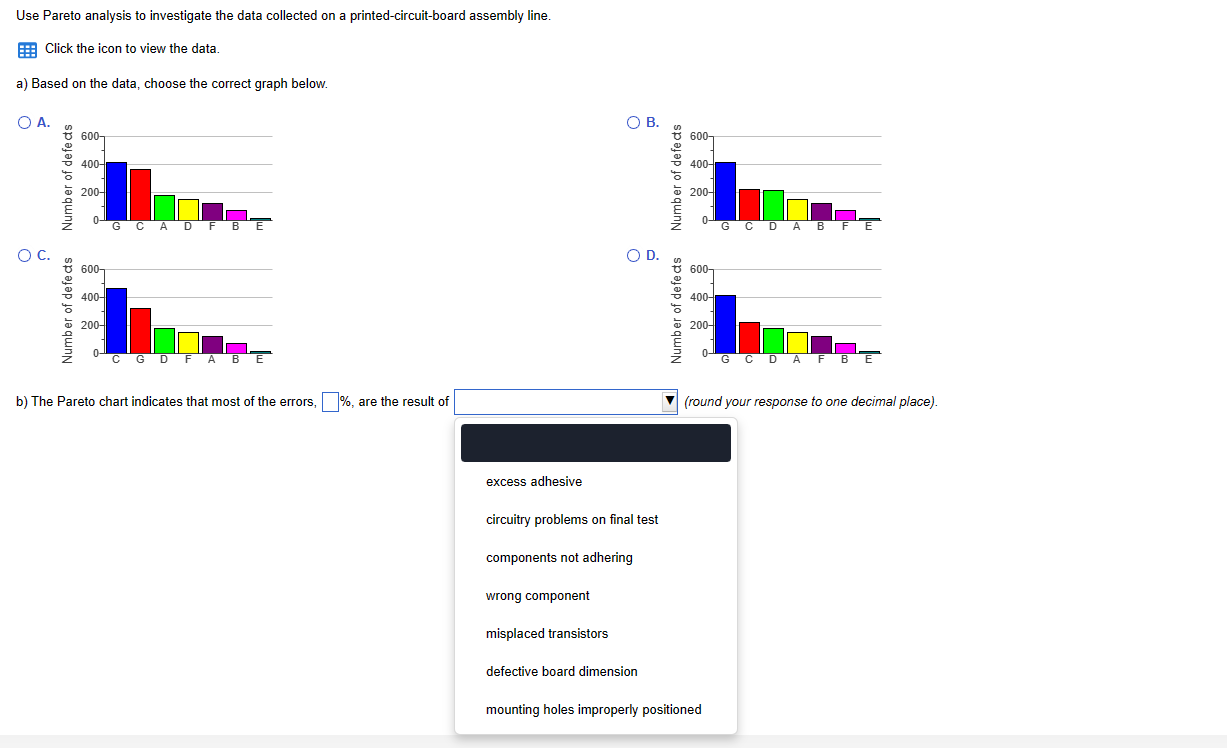
Use Pareto analysis to investigate the data collected on a printed-circuit-board assembly line. Click the icon to view the data. a) Based on the

Use Pareto analysis to investigate the data collected on a printed-circuit-board assembly line. Click the icon to view the data. a) Based on the data, choose the correct graph below. O A. O C. Number of defects Number of defects 600- 400- 200- 600- 400- 200- G C CAD F F B BE CGDF A B E b) The Pareto chart indicates that most of the errors, %, are the result of excess adhesive O B. circuitry problems on final test wrong component O D. components not adhering misplaced transistors defective board dimension Number of defects Number of defects 600- 400- 200- 0- 600- 400- 200- mounting holes improperly positioned 0- G C D A B F GCD AF BE (round your response to one decimal place).
Step by Step Solution
★★★★★
3.53 Rating (146 Votes )
There are 3 Steps involved in it
Step: 1
The Pareto analysis also known as the Pareto chart or diagram is a visual tool ...
Get Instant Access to Expert-Tailored Solutions
See step-by-step solutions with expert insights and AI powered tools for academic success
Step: 2

Step: 3

Ace Your Homework with AI
Get the answers you need in no time with our AI-driven, step-by-step assistance
Get Started


