Answered step by step
Verified Expert Solution
Link Copied!

Question

1 Approved Answer

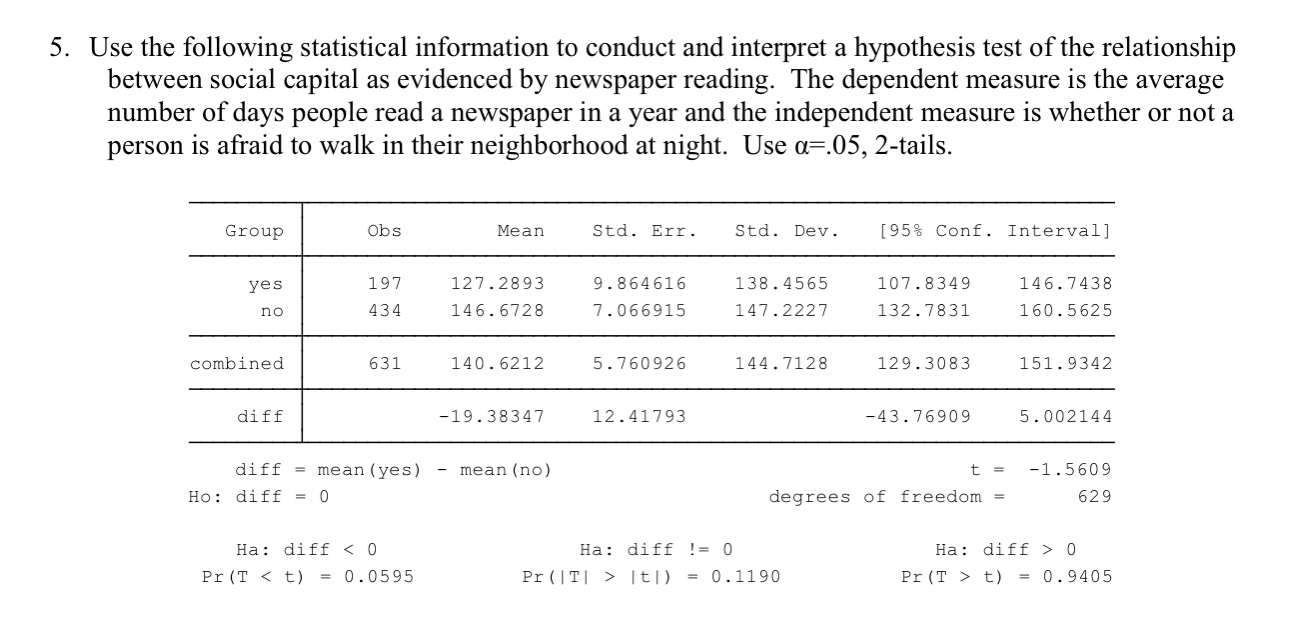
Use photo for context. Use the following statistical information to conduct and interpret a hypothesis test of the relationship between social capital as evidenced by

Use photo for context.

image text in transcribed
Use the following statistical information to conduct and interpret a hypothesis test of the relationship between social capital as evidenced by newspaper reading. The dependent measure is the average number of days people read a newspaper in a year and the independent measure is whether or not a person is afraid to walk in their neighborhood at night. Use (1:.05, 2-tails. Group Obs Mean Std. Err. Std. Dev. [95% Conf. Interval] yes 197 127.2893 9.864616 138.4565 107.8349 146.7438 no 434 146.6728 7.066915 147.2227 132.7831 160.5625 combined 631 140.6212 5.760926 144.7128 129.3083 151.9342 diff 19.38347 12.41793 43.76909 5.002144 diff = meantyes) mean(no) t = 1.5609 Ho: diff = 0 degrees of freedom = 629 Ha: diff 0 PI(T Itlj = 0.1190 Pr(T > t) = 0.9405

Step by Step Solution

There are 3 Steps involved in it

Step: 1

blur-text-image

Get Instant Access to Expert-Tailored Solutions

See step-by-step solutions with expert insights and AI powered tools for academic success

Step: 2

blur-text-image

Step: 3

blur-text-image

Ace Your Homework with AI

Get the answers you need in no time with our AI-driven, step-by-step assistance

Get Started

Recommended Textbook for

Linear Algebra and Its Applications

Authors: Gilbert Strang

4th edition

30105678, 30105676, 978-0030105678

More Books

Students also viewed these Mathematics questions