

Answered step by step
Verified Expert Solution
Question
1 Approved Answer
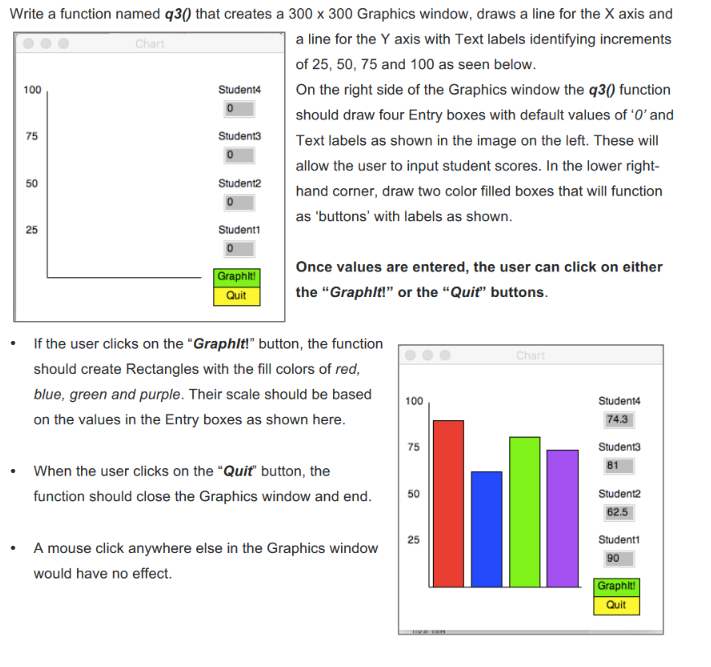
Use Python 3 or above Write a function named q30 that creates a 300 x 300 Graphics window, draws a line for the X axis
Use Python 3 or above
Write a function named q30 that creates a 300 x 300 Graphics window, draws a line for the X axis and a line for the Y axis with Text labels identifying increments of 25, 50, 75 and 100 as seen below Ch 100 Student4 On the right side of the Graphics window the q30 function should draw four Entry boxes with default values of 0'and Text labels as shown in the image on the left. These will allow the user to input student scores. In the lower right hand corner, draw two color filled boxes that will function as 'buttons' with labels as shown 75 50 25 Once values are entered, the user can click on either aphlt Quit the "Graphlt" or the "Quit" buttons .If the user clicks on the "Graphlt!" button, the function should create Rectangles with the fill colors of red blue, green and purple. Their scale should be based100 on the values in the Entry boxes as shown here 74.3 75 When the user clicks on the "Quit" button, the function should close the Graphics window and end 50 62.5 25 A mouse click anywhere else in the Graphics window would have no effect. Quit Write a function named q30 that creates a 300 x 300 Graphics window, draws a line for the X axis and a line for the Y axis with Text labels identifying increments of 25, 50, 75 and 100 as seen below Ch 100 Student4 On the right side of the Graphics window the q30 function should draw four Entry boxes with default values of 0'and Text labels as shown in the image on the left. These will allow the user to input student scores. In the lower right hand corner, draw two color filled boxes that will function as 'buttons' with labels as shown 75 50 25 Once values are entered, the user can click on either aphlt Quit the "Graphlt" or the "Quit" buttons .If the user clicks on the "Graphlt!" button, the function should create Rectangles with the fill colors of red blue, green and purple. Their scale should be based100 on the values in the Entry boxes as shown here 74.3 75 When the user clicks on the "Quit" button, the function should close the Graphics window and end 50 62.5 25 A mouse click anywhere else in the Graphics window would have no effect. QuitStep by Step Solution
There are 3 Steps involved in it
Step: 1

Get Instant Access to Expert-Tailored Solutions
See step-by-step solutions with expert insights and AI powered tools for academic success
Step: 2

Step: 3
Ace Your Homework with AI
Get the answers you need in no time with our AI-driven, step-by-step assistance
Get Started
Oracle PL/SQL Programming Database Management Systems
Authors: Steven Feuerstein
1st Edition
978-1565921429