

Answered step by step
Verified Expert Solution
Question
1 Approved Answer
Use python 3 random number generator! Plots in part a: b) Tests of Uniformity For a sequence of pseudo-random numbers by 1 of 2 the
Use python 3 random number generator!

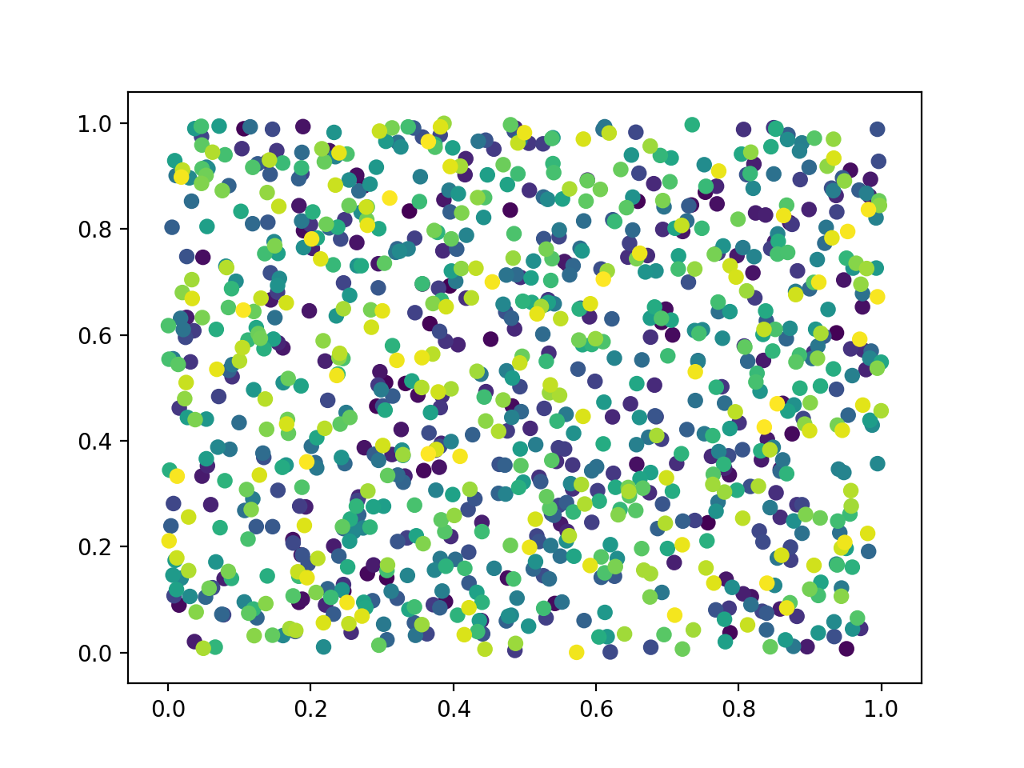
Plots in part a:
Step by Step Solution
There are 3 Steps involved in it
Step: 1

Get Instant Access to Expert-Tailored Solutions
See step-by-step solutions with expert insights and AI powered tools for academic success
Step: 2

Step: 3
Ace Your Homework with AI
Get the answers you need in no time with our AI-driven, step-by-step assistance
Get Started
Learning PostgreSQL
Authors: Salahaldin Juba, Achim Vannahme, Andrey Volkov
1st Edition
178398919X, 9781783989195