Answered step by step
Verified Expert Solution
Question
1 Approved Answer
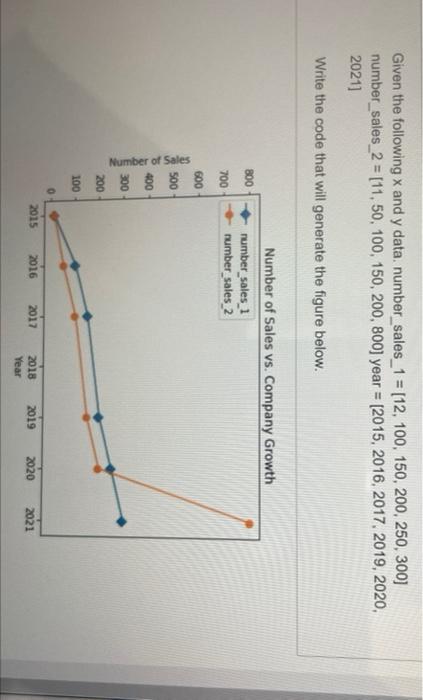
use python Given the following x and y data number_sales_1 = [12, 100, 150, 200, 250, 300) number_sales_2 = [11,50, 100, 150, 200, 800] year
use python 
Given the following x and y data number_sales_1 = [12, 100, 150, 200, 250, 300) number_sales_2 = [11,50, 100, 150, 200, 800] year = [2015, 2016, 2017, 2019, 2020, 2021] Write the code that will generate the figure below. 800 Number of Sales vs. Company Growth number_sales_1 number_sales_2 700 600 500 Number of Sales 400 300 200 100 2015 2016 2017 2019 2018 Year 2020 2021 
Step by Step Solution
There are 3 Steps involved in it
Step: 1

Get Instant Access to Expert-Tailored Solutions
See step-by-step solutions with expert insights and AI powered tools for academic success
Step: 2

Step: 3

Ace Your Homework with AI
Get the answers you need in no time with our AI-driven, step-by-step assistance
Get Started


