use python. i just need. code for the 3 rd question.
| Date | Open | High | Low | Close | Adj Close | Volume | |
| 1/3/50 | 16.66 | 16.66 | 16.66 | 16.66 | 16.66 | 1260000 | |
| 1/4/50 | 16.85 | 16.85 | 16.85 | 16.85 | 16.85 | 1890000 | |
| 1/5/50 | 16.93 | 16.93 | 16.93 | 16.93 | 16.93 | 2550000 | |
| 1/6/50 | 16.98 | 16.98 | 16.98 | 16.98 | 16.98 | 2010000 | |
| 1/9/50 | 17.08 | 17.08 | 17.08 | 17.08 | 17.08 | 2520000 | |
| 1/10/50 | 17.030001 | 17.030001 | 17.030001 | 17.030001 | 17.030001 | 2160000 | |
| 1/11/50 | 17.09 | 17.09 | 17.09 | 17.09 | 17.09 | 2630000 | |
| 1/12/50 | 16.76 | 16.76 | 16.76 | 16.76 | 16.76 | 2970000 | |
| 1/13/50 | 16.67 | 16.67 | 16.67 | 16.67 | 16.67 | 3330000 | |
| 1/16/50 | 16.719999 | 16.719999 | 16.719999 | 16.719999 | 16.719999 | 1460000 | |
| 1/17/50 | 16.860001 | 16.860001 | 16.860001 | 16.860001 | 16.860001 | 1790000 | |
| 1/18/50 | 16.85 | 16.85 | 16.85 | 16.85 | 16.85 | 1570000 | |
| 1/19/50 | 16.870001 | 16.870001 | 16.870001 | 16.870001 | 16.870001 | 1170000 | |
| 1/20/50 | 16.9 | 16.9 | 16.9 | 16.9 | 16.9 | 1440000 | |
| 1/23/50 | 16.92 | 16.92 | 16.92 | 16.92 | 16.92 | 1340000 | |
| | | | | | | | |
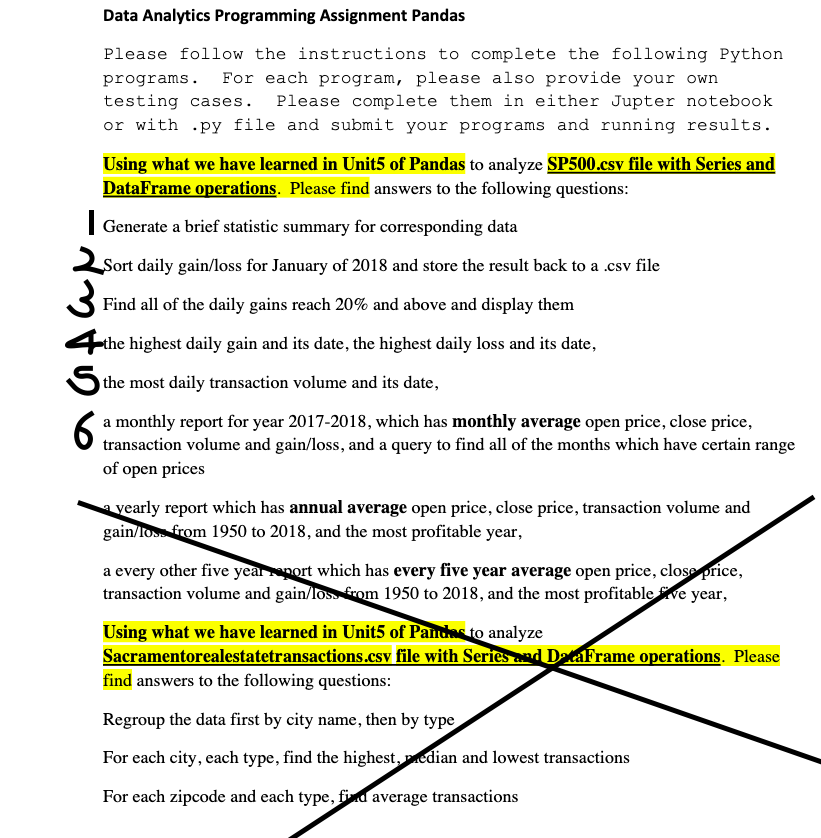
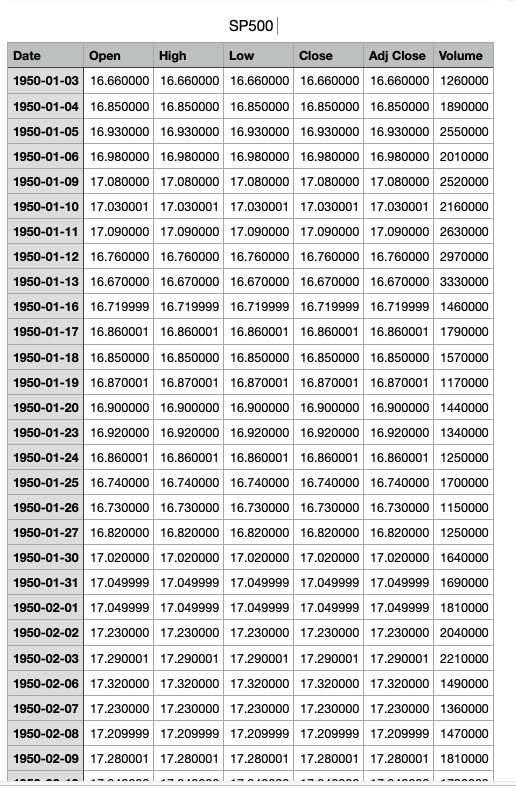
Data Analytics Programming Assignment Pandas Please follow the instructions to complete the following Python programs. For each program, please also provide your own testing cases. Please complete them in either Jupter notebook or with .py file and submit your programs and running results. Using what we have learned in Unit5 of Pandas to analyze SP500.csv file with Series and DataFrame operations. Please find answers to the following questions: | Generate a brief statistic summary for corresponding data 2 sort daily gain/loss for January of 2018 and store the result back to a .csv file 3 Find all of the daily gains reach 20% and above and display them the highest daily gain and its date, the highest daily loss and its date, S the most daily transaction volume and its date, 6 transaction volume and gain/loss, and a query to find all of the months which have certain range of open prices yearly report which has annual average open price, close price, transaction volume and gain/Io. from 1950 to 2018, and the most profitable year, a every other five yearport which has every five year average open price, close price, transaction volume and gain/Os from 1950 to 2018, and the most profitable se year, Using what we have learned in Unit5 of Panches to analyze Sacramentorealestatetransactions.csv file with Series and DataFrame operations. Please find answers to the following questions: Regroup the data first by city name, then by type For each city, each type, find the highest, median and lowest transactions For each zipcode and each type, find average transactions SP500 Date Open High Low Close Adj Close Volume 1950-01-03 16.660000 16.660000 16.660000 16.660000 16.660000 1260000 1950-01-04 16.850000 16.850000 16.850000 16.850000 16.850000 1890000 1950-01-05 16.930000 16.930000 16.930000 16.930000 16.930000 2550000 1950-01-06 16.980000 16.980000 16.980000 16.980000 16.980000 2010000 1950-01-09 17.080000 17.080000 17.080000 17.080000 17.080000 2520000 1950-01-10 17.030001 17.030001 17.030001 17.030001 17.030001 2160000 1950-01-11 17.090000 17.090000 17.090000 17.090000 17.090000 2630000 1950-01-12 16.760000 16.760000 16.760000 16.760000 16.760000 2970000 1950-01-13 16.670000 16.670000 16.670000 16.670000 16.670000 3330000 1950-01-16 16.719999 16.719999 16.719999 16.719999 16.719999 1460000 1950-01-17 16.860001 16.860001 16.860001 16.860001 16.860001 1790000 1950-01-18 16.850000 16.850000 16.850000 16.850000 16.850000 1570000 1950-01-19 16.870001 16.870001 16.870001 16.870001 16.870001 1170000 1950-01-20 16.900000 16.900000 16.900000 16.900000 16.900000 1440000 1950-01-23 16.920000 16.920000 16.920000 16.920000 16.920000 1340000 1950-01-24 16.860001 16.860001 16.860001 16.860001 16.860001 1250000 1950-01-25 16.740000 16.740000 16.740000 16.740000 16.740000 1700000 1950-01-26 16.730000 16.730000 16.730000 16.730000 16.730000 1150000 1950-01-27 16.820000 16.820000 16.820000 16.820000 16.820000 1250000 1950-01-30 17.020000 17.020000 17.020000 17.020000 17.020000 1640000 1950-01-31 17.049999 17.049999 17.049999 17.049999 17.049999 1690000 1950-02-01 17.049999 17.049999 17.049999 17.049999 17.049999 1810000 1950-02-02 17.230000 17.230000 17.230000 17.230000 17.230000 2040000 1950-02-03 17.290001 17.290001 17.290001 17.290001 17.290001 2210000 1950-02-06 17.320000 17.320000 17.320000 17.320000 17.320000 1490000 1950-02-07 17.230000 17.230000 17.230000 17.230000 17.230000 1360000 1950-02-08 17.209999 17.209999 17.209999 17.209999 17.209999 1470000 1950-02-09 17.280001 17.280001 17.280001 17.280001 17.280001 1810000 Data Analytics Programming Assignment Pandas Please follow the instructions to complete the following Python programs. For each program, please also provide your own testing cases. Please complete them in either Jupter notebook or with .py file and submit your programs and running results. Using what we have learned in Unit5 of Pandas to analyze SP500.csv file with Series and DataFrame operations. Please find answers to the following questions: | Generate a brief statistic summary for corresponding data 2 sort daily gain/loss for January of 2018 and store the result back to a .csv file 3 Find all of the daily gains reach 20% and above and display them the highest daily gain and its date, the highest daily loss and its date, S the most daily transaction volume and its date, 6 transaction volume and gain/loss, and a query to find all of the months which have certain range of open prices yearly report which has annual average open price, close price, transaction volume and gain/Io. from 1950 to 2018, and the most profitable year, a every other five yearport which has every five year average open price, close price, transaction volume and gain/Os from 1950 to 2018, and the most profitable se year, Using what we have learned in Unit5 of Panches to analyze Sacramentorealestatetransactions.csv file with Series and DataFrame operations. Please find answers to the following questions: Regroup the data first by city name, then by type For each city, each type, find the highest, median and lowest transactions For each zipcode and each type, find average transactions SP500 Date Open High Low Close Adj Close Volume 1950-01-03 16.660000 16.660000 16.660000 16.660000 16.660000 1260000 1950-01-04 16.850000 16.850000 16.850000 16.850000 16.850000 1890000 1950-01-05 16.930000 16.930000 16.930000 16.930000 16.930000 2550000 1950-01-06 16.980000 16.980000 16.980000 16.980000 16.980000 2010000 1950-01-09 17.080000 17.080000 17.080000 17.080000 17.080000 2520000 1950-01-10 17.030001 17.030001 17.030001 17.030001 17.030001 2160000 1950-01-11 17.090000 17.090000 17.090000 17.090000 17.090000 2630000 1950-01-12 16.760000 16.760000 16.760000 16.760000 16.760000 2970000 1950-01-13 16.670000 16.670000 16.670000 16.670000 16.670000 3330000 1950-01-16 16.719999 16.719999 16.719999 16.719999 16.719999 1460000 1950-01-17 16.860001 16.860001 16.860001 16.860001 16.860001 1790000 1950-01-18 16.850000 16.850000 16.850000 16.850000 16.850000 1570000 1950-01-19 16.870001 16.870001 16.870001 16.870001 16.870001 1170000 1950-01-20 16.900000 16.900000 16.900000 16.900000 16.900000 1440000 1950-01-23 16.920000 16.920000 16.920000 16.920000 16.920000 1340000 1950-01-24 16.860001 16.860001 16.860001 16.860001 16.860001 1250000 1950-01-25 16.740000 16.740000 16.740000 16.740000 16.740000 1700000 1950-01-26 16.730000 16.730000 16.730000 16.730000 16.730000 1150000 1950-01-27 16.820000 16.820000 16.820000 16.820000 16.820000 1250000 1950-01-30 17.020000 17.020000 17.020000 17.020000 17.020000 1640000 1950-01-31 17.049999 17.049999 17.049999 17.049999 17.049999 1690000 1950-02-01 17.049999 17.049999 17.049999 17.049999 17.049999 1810000 1950-02-02 17.230000 17.230000 17.230000 17.230000 17.230000 2040000 1950-02-03 17.290001 17.290001 17.290001 17.290001 17.290001 2210000 1950-02-06 17.320000 17.320000 17.320000 17.320000 17.320000 1490000 1950-02-07 17.230000 17.230000 17.230000 17.230000 17.230000 1360000 1950-02-08 17.209999 17.209999 17.209999 17.209999 17.209999 1470000 1950-02-09 17.280001 17.280001 17.280001 17.280001 17.280001 1810000