

Answered step by step
Verified Expert Solution
Question
1 Approved Answer
use python Model 1 : An exponential growth model for an epidemic The simplest reasonable model for the early stages of the growth of an
use python
Model : An exponential growth model for an epidemic
The simplest reasonable model for the early stages of the growth of an epidemic is one where the rate of change of the number of individuals with the
disease is proportional to the number of people who already have the disease. We can see this assumes that the people with the disease are mixed in
amongst the people without the disease, such that the number of people a sick person meets is a constant. It also assumes that people do not recover
from the disease, at least over the time period of interest. This is characteristic of the earliest phases of the spread of a disease, when there are no controls
put in place to restrict the motion of people, there are many more people who are healthy compared with those who are sick, and the sick haven't yet
recovered.
The model can be written as a differential equation:
where is the number of people with the disease at time and is a measure of how many healthy people each sick person infects. The solution to this
model is
Aexp
where is the number of infected people at time
Model : A subexponential growth model for an epidemic
There are numerous more sophisticated models for epidemic growth. We shall consider the following modification of the previous exponential growth
model:
where gives a measure how the growth rate new cases depends the number infected people. The solution this model
where and now
this lab will compare model and model with early covid data.
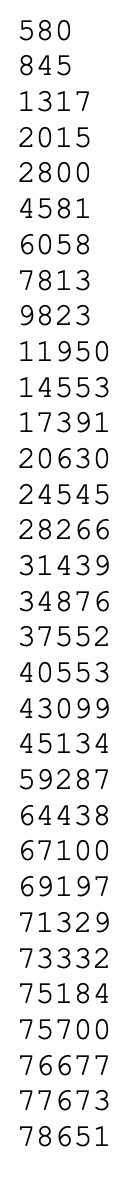
Below the lab on Canvas you will find a file COVIDallcases.txt This file contains the total number of recorded cases up to that day in the early phase of the pandemic. The first record corresponds to January nd the second to January rd etc.
Read the data into a numpy array. You do not need to use pandas to do this. One approach is to set up a list, open the file, read each line in the file and append the result to the list. Once the list is complete you can convert it to a numpy array.
a Plot the data
Using matplotlib, plot the data versus time. Can we identify by eye any phases in the disease spread?
There appears to be a period of rapid growth concave up followed by a steadily slowing growth concave down There is also a significant jump in the number of cases, which when looking at the data collection, is due to a change in the way cases have been recorded.
b Looking only at the first five data points lets call this data day to day find a value of r which fits the exponential model to this data. Plot the data and the exponential model together over the first days. What can we conclude about the exponential model?
Type Markdown and LaTeX:
c Now, using your exponential model, extrapolate backwards in time to find the predicted day when 'patient zero' appeared ie when the number of
infected people first goes below one The disease is thought to have appeared on December st Identify a plausible reason for a discrepancy
between your model and this date.
Type Markdown and LaTeX:
d Fixing for Model determine a value for by comparing the first days of data with the model. Plot the data and model out to day Can we
conclude anything about the spread of the disease in light of the model dynamics?
Type Markdown and LaTeX:
ecreate a png plot showing the data, and models and out to day the end of the data Constrain the y axis to a maximum value of PInclude a legend in your graph and label your axes.
COVIDallcases.txt:
Step by Step Solution
There are 3 Steps involved in it
Step: 1

Get Instant Access to Expert-Tailored Solutions
See step-by-step solutions with expert insights and AI powered tools for academic success
Step: 2

Step: 3
Ace Your Homework with AI
Get the answers you need in no time with our AI-driven, step-by-step assistance
Get Started
Expert Oracle9i Database Administration
Authors: Sam R. Alapati
1st Edition
1590590228, 978-1590590225