 Use Python Please and try to comment where possible
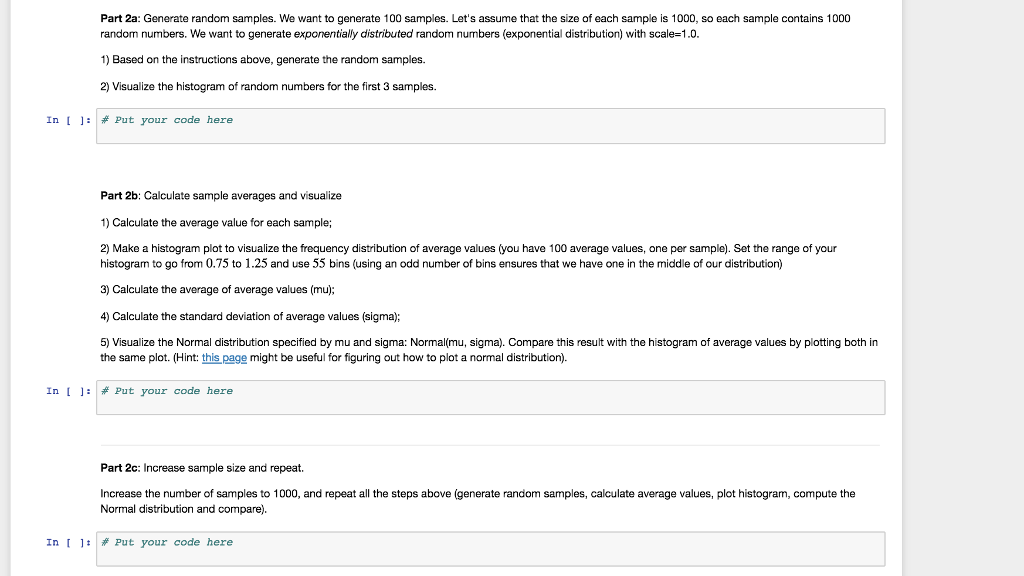
Part 2a: Generate random samples. We want to generate 100 samples. Let's assume that the size of each sample is 1000, so each sample contains 1000 random numbers. We want to generate exponentially distributed random numbers (exponential distribution) with scale 1.0. Based on the instructions above, generate the random samples. 2) Visualize the histogram of random numbers for the first 3 samples In [ ]: # Put your code here Part 2b: Calculate sample averages and visualize 1) Calculate the average value for each sample 2) Make a histogram plot to visualize the frequency distribution of average values (you have 100 average values, one per sample). Set the range of your histogram to go from 0.75 to 1.25 and use 55 bins (using an odd number of bins ensures that we have one in the middle of our distribution) 3) Calculate the average of average values (mu); 4) Calculate the standard deviation of average values (sigma); 5) Visualize the Normal distribution specified by mu and sigma: Normal(mu, sigma). Compare this result with the histogram of average values by plotting both in the same plot. (Hint: this page might be useful for figuring out how to plot a normal distribution. In [ ]: | # Put your code here Part 2c: Increase sample size and repeat. Increase the number of samples to 1000, and repeat all the steps above (generate random samples, calculate average values, plot histogram, compute the Normal distribution and compare) In [ 1: | # Put your code here Part 2a: Generate random samples. We want to generate 100 samples. Let's assume that the size of each sample is 1000, so each sample contains 1000 random numbers. We want to generate exponentially distributed random numbers (exponential distribution) with scale 1.0. Based on the instructions above, generate the random samples. 2) Visualize the histogram of random numbers for the first 3 samples In [ ]: # Put your code here Part 2b: Calculate sample averages and visualize 1) Calculate the average value for each sample 2) Make a histogram plot to visualize the frequency distribution of average values (you have 100 average values, one per sample). Set the range of your histogram to go from 0.75 to 1.25 and use 55 bins (using an odd number of bins ensures that we have one in the middle of our distribution) 3) Calculate the average of average values (mu); 4) Calculate the standard deviation of average values (sigma); 5) Visualize the Normal distribution specified by mu and sigma: Normal(mu, sigma). Compare this result with the histogram of average values by plotting both in the same plot. (Hint: this page might be useful for figuring out how to plot a normal distribution. In [ ]: | # Put your code here Part 2c: Increase sample size and repeat. Increase the number of samples to 1000, and repeat all the steps above (generate random samples, calculate average values, plot histogram, compute the Normal distribution and compare) In [ 1: | # Put your code here