

Answered step by step
Verified Expert Solution
Question
1 Approved Answer
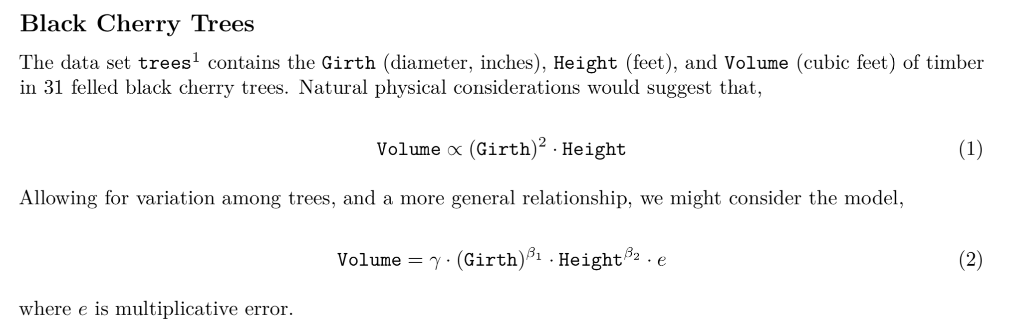
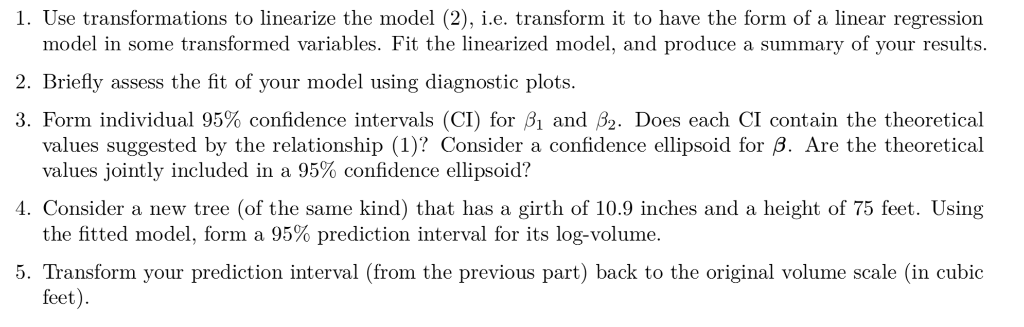
Use R Code to solve the following: Data set trees is in the datasets package, which is automatically available, so you do not need any
Use R Code to solve the following:
Data set trees is in the datasets package, which is automatically available, so you do not need any other package to load it
Step by Step Solution
There are 3 Steps involved in it
Step: 1

Get Instant Access to Expert-Tailored Solutions
See step-by-step solutions with expert insights and AI powered tools for academic success
Step: 2

Step: 3
Ace Your Homework with AI
Get the answers you need in no time with our AI-driven, step-by-step assistance
Get Started
Repairing And Querying Databases Under Aggregate Constraints
Authors: Sergio Flesca ,Filippo Furfaro ,Francesco Parisi
2011th Edition
146141640X, 978-1461416401