use r language rstudio
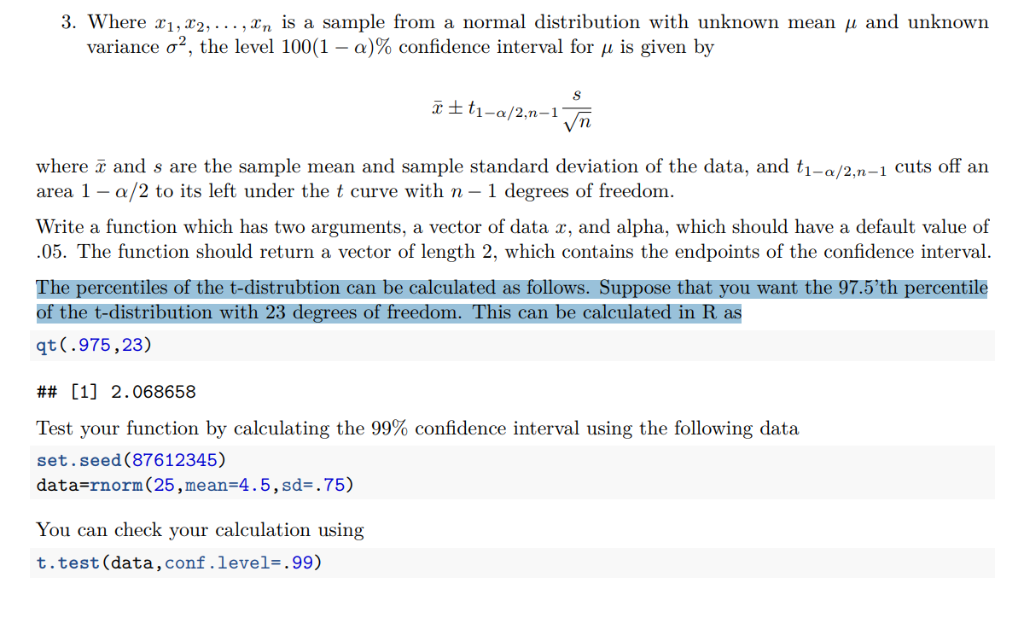
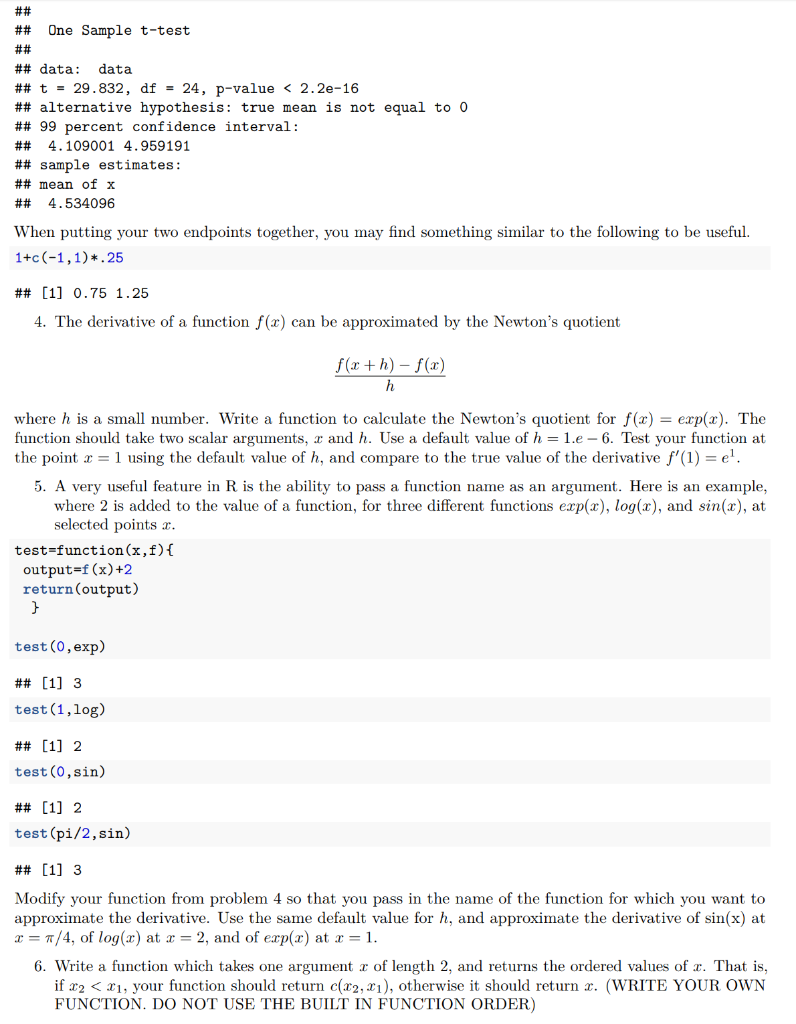
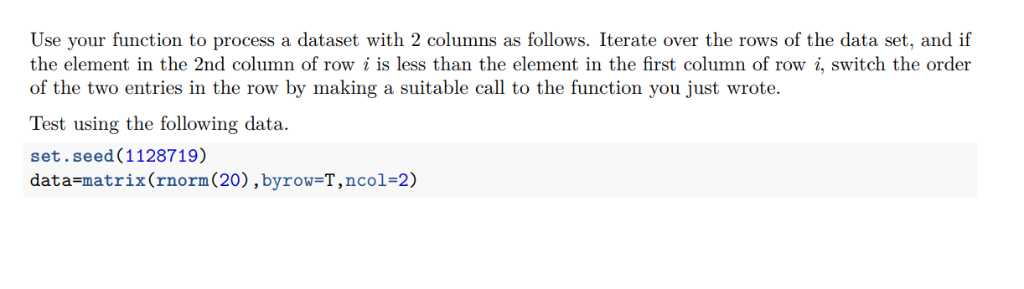
3. Where x1,x2, ,Fn s a sample from a normal distribution with unknown mean and unknown variance 2, the level 100(1-a)% confidence interval for is given by where and s are the sample mean and sample standard deviation of the data, and t1-a/2,- cuts off an area 1 - a/2 to its left under the t curve with n -1 degrees of freedom. Write a function which has two arguments, a vector of data x, and alpha, which should have a default value of .05. The function should return a vector of length 2 which contains the endpoints of the confidence interval. The percentiles of the t-distrubtion can be calculated as follows. Suppose that you want the 97.5'th percentile of the t-distribution with 23 degrees of freedom. This can be calculated in R as qt.975,23) ## [1] 2.068658 Test your function by calculating the 99% confidence interval using the following data set.seed(87612345) data-rnorm (25,mean-4.5,sd-.75) You can check your calculation using t.test (data,conf.level-.99) Use your function to process a dataset with 2 columns as follows. Iterate over the rows of the data set, and if the element in the 2nd column of row i is less than the element in the first column of row i, switch the order of the two entries in the row by making a suitable call to the function you just wrote. Test using the following data. set.seed (1128719) data-matrix(rnorm (20) , byrow-T,ncol-2) 3. Where x1,x2, ,Fn s a sample from a normal distribution with unknown mean and unknown variance 2, the level 100(1-a)% confidence interval for is given by where and s are the sample mean and sample standard deviation of the data, and t1-a/2,- cuts off an area 1 - a/2 to its left under the t curve with n -1 degrees of freedom. Write a function which has two arguments, a vector of data x, and alpha, which should have a default value of .05. The function should return a vector of length 2 which contains the endpoints of the confidence interval. The percentiles of the t-distrubtion can be calculated as follows. Suppose that you want the 97.5'th percentile of the t-distribution with 23 degrees of freedom. This can be calculated in R as qt.975,23) ## [1] 2.068658 Test your function by calculating the 99% confidence interval using the following data set.seed(87612345) data-rnorm (25,mean-4.5,sd-.75) You can check your calculation using t.test (data,conf.level-.99) Use your function to process a dataset with 2 columns as follows. Iterate over the rows of the data set, and if the element in the 2nd column of row i is less than the element in the first column of row i, switch the order of the two entries in the row by making a suitable call to the function you just wrote. Test using the following data. set.seed (1128719) data-matrix(rnorm (20) , byrow-T,ncol-2)