Answered step by step
Verified Expert Solution
Question
1 Approved Answer
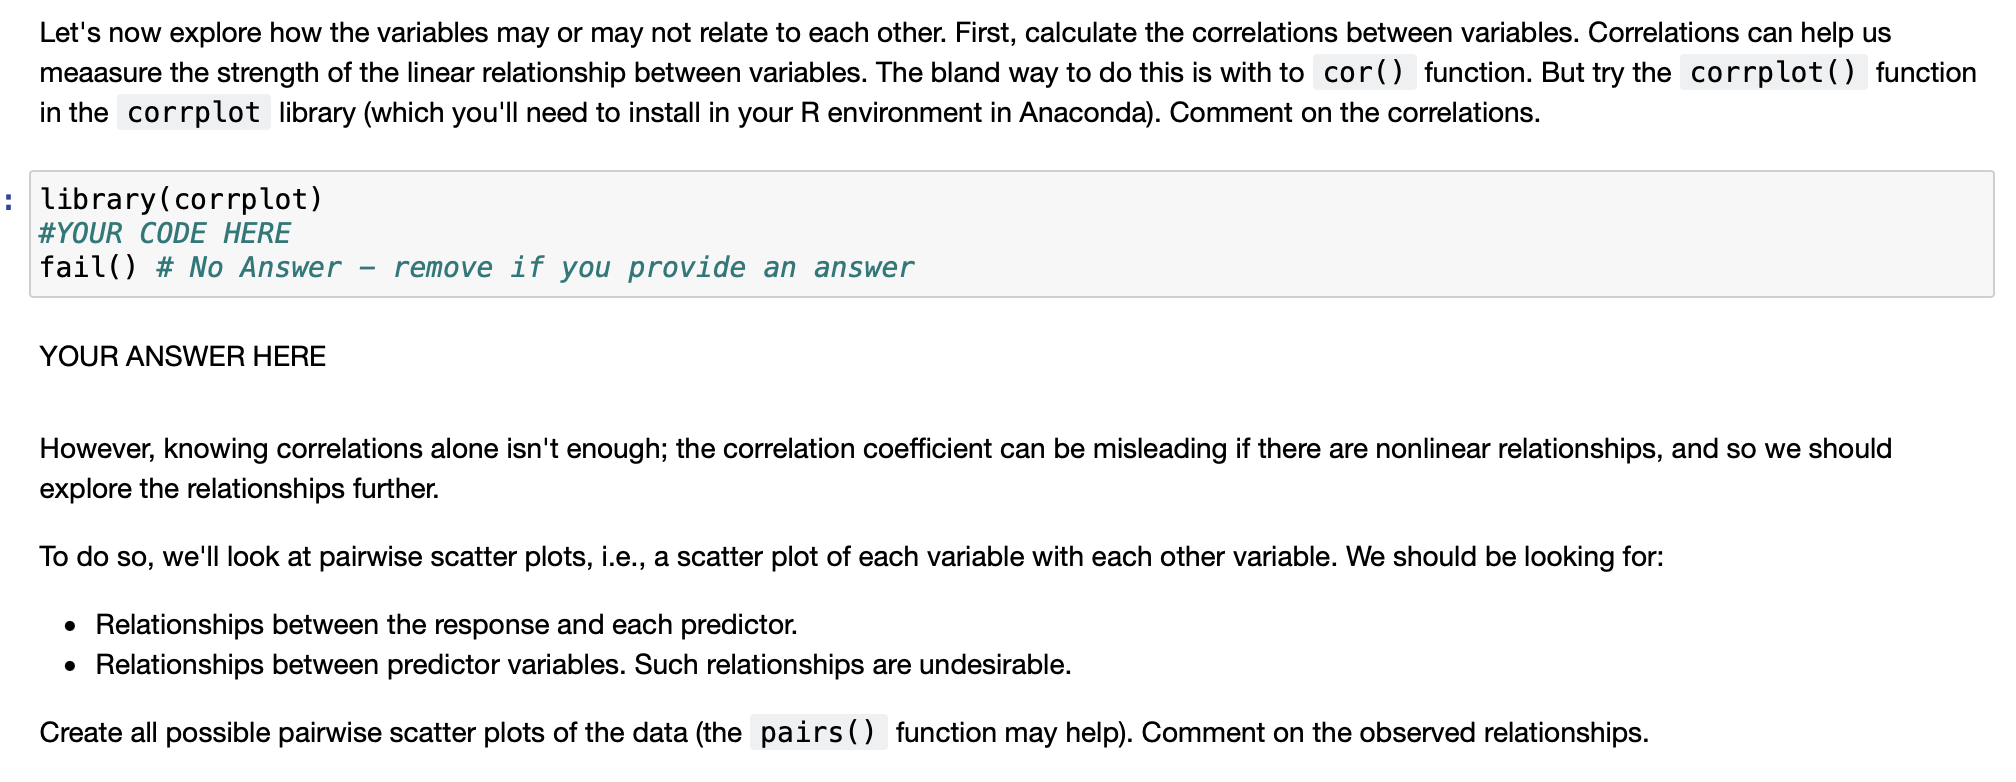
use R Let's now explore how the variables may or may not relate to each other. First, calculate the correlations between variables. Correlations can help

use R
Let's now explore how the variables may or may not relate to each other. First, calculate the correlations between variables. Correlations can help us meaasure the strength of the linear relationship between variables. The bland way to do this is with to cor() function. But try the corrplot() function in the corrplot library (which you'll need to install in your R environment in Anaconda). Comment on the correlations. : library(corrplot) #YOUR CODE HERE fail() # No Answer remove if you provide an answer YOUR ANSWER HERE However, knowing correlations alone isn't enough; the correlation coefficient can be misleading if there are nonlinear relationships, and so we should explore the relationships further. To do so, we'll look at pairwise scatter plots, i.e., a scatter plot of each variable with each other variable. We should be looking for: Relationships between the response and each predictor. Relationships between predictor variables. Such relationships are undesirable. Create all possible pairwise scatter plots of the data (the pairs() function may help). Comment on the observed relationships. Let's now explore how the variables may or may not relate to each other. First, calculate the correlations between variables. Correlations can help us meaasure the strength of the linear relationship between variables. The bland way to do this is with to cor() function. But try the corrplot() function in the corrplot library (which you'll need to install in your R environment in Anaconda). Comment on the correlations. : library(corrplot) #YOUR CODE HERE fail() # No Answer remove if you provide an answer YOUR ANSWER HERE However, knowing correlations alone isn't enough; the correlation coefficient can be misleading if there are nonlinear relationships, and so we should explore the relationships further. To do so, we'll look at pairwise scatter plots, i.e., a scatter plot of each variable with each other variable. We should be looking for: Relationships between the response and each predictor. Relationships between predictor variables. Such relationships are undesirable. Create all possible pairwise scatter plots of the data (the pairs() function may help). Comment on the observed relationshipsStep by Step Solution
There are 3 Steps involved in it
Step: 1

Get Instant Access to Expert-Tailored Solutions
See step-by-step solutions with expert insights and AI powered tools for academic success
Step: 2

Step: 3

Ace Your Homework with AI
Get the answers you need in no time with our AI-driven, step-by-step assistance
Get Started


