use R square it uses this data:
install.packages("mlbench") library(mlbench) data(PimaIndiansDiabetes) 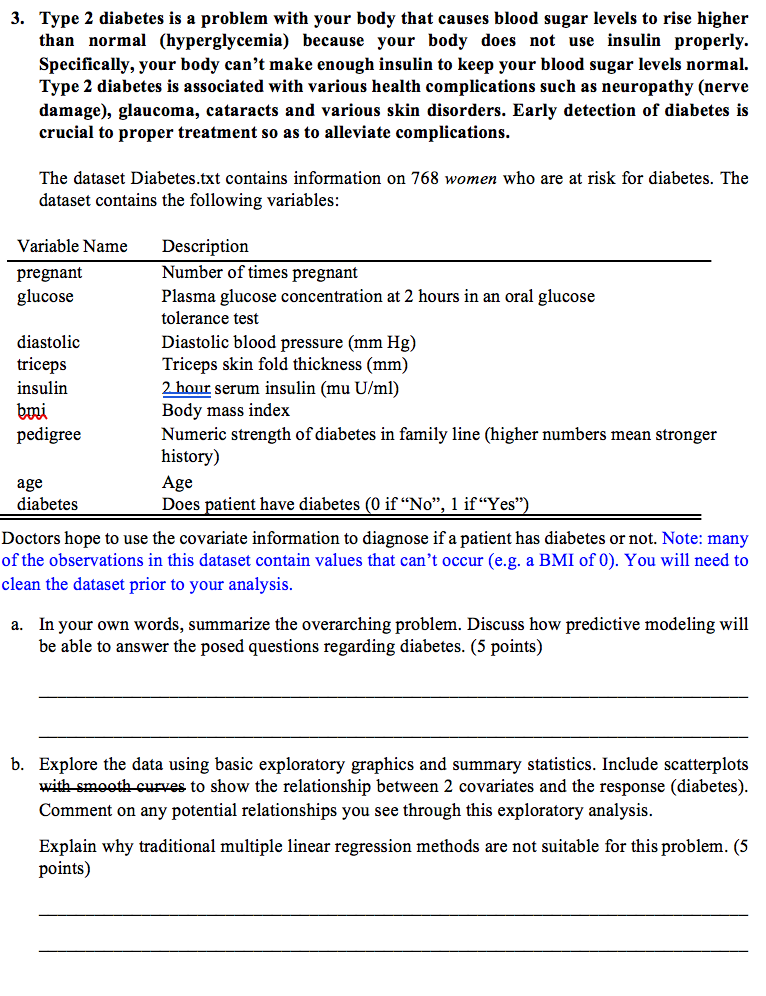
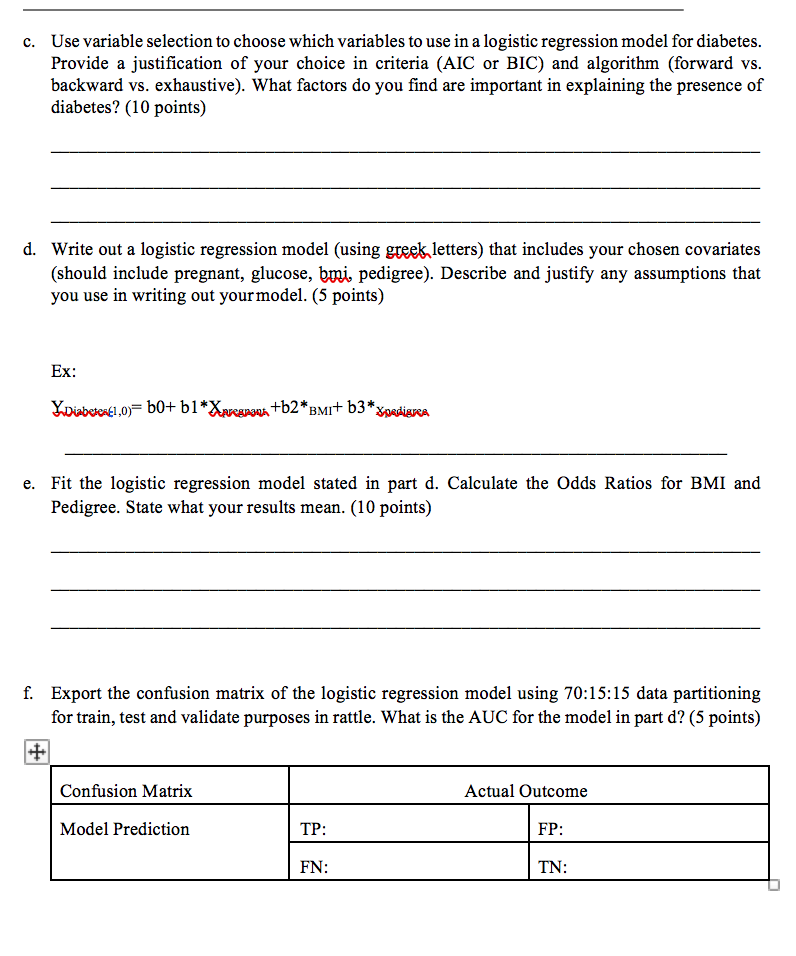
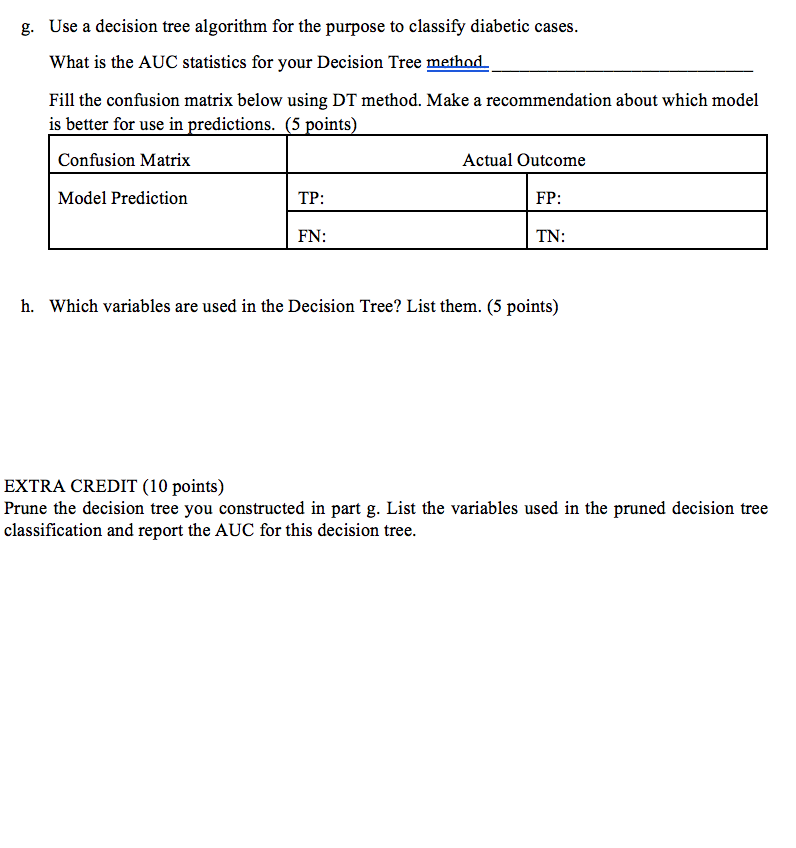
3. Type 2 diabetes is a problem with your body that causes blood sugar levels to rise higher than normal (hyperglycemia) because your body does not use insulin properly. Specifically, your body can't make enough insulin to keep your blood sugar levels normal. Type 2 diabetes is associated with various health complications such as neuropathy (nerve damage), glaucoma, cataracts and various skin disorders. Early detection of diabetes is crucial to proper treatment so as to alleviate complications. The dataset Diabetes.txt contains information on 768 women who are at risk for diabetes. The dataset contains the following variables Variable Name Description pregnant glucose Number of times pregnant Plasma glucose concentration at 2 hours in an oral glucose tolerance test Diastolic blood pressure (mm Hg) Triceps skin fold thickness (mm) 2 hour serum insulin (mu U/ml) Body mass index Numeric strength of diabetes in family line (higher numbers mean stronger history) Age Does patient have diabetes (0 if "No", 1 if"Yes" diastolic triceps nsulin bmi pedigree age diabetes Doctors hope to use the covariate information to diagnose if a patient has diabetes or not. Note: many of the observations in this dataset contain values that can't occur (e.g. a BMI of 0). You will need to clean the dataset prior to your analysis In your own words, summarize the overarching problem. Discuss how predictive modeling will be able to answer the posed questions regarding diabetes. (5 points) a. b. Explore the data using basic exploratory graphics and summary statistics. Include scatterplots with smeeth curves to show the relationship between 2 covariates and the response (diabetes) Comment on any potential relationships you see through this exploratory analysis. Explain why traditional multiple linear regression methods are not suitable for this problem. (5 points) g. Use a decision tree algorithm for the purpose to classify diabetic cases What is the AUC statistics for your Decision Tree method_ Fill the confusion matrix below using DT method. Make a recommendation about which model is better for use in predictions. (5 points) Confusion Matrix Actual Outcome Model Prediction TP: FN; TN: h. Which variables are used in the Decision Tree? List them. (5 points) EXTRA CREDIT (10 points) Prune the decision tree you constructed in part g. List the variables used in the pruned decision tree classification and report the AUC for this decision tree. 3. Type 2 diabetes is a problem with your body that causes blood sugar levels to rise higher than normal (hyperglycemia) because your body does not use insulin properly. Specifically, your body can't make enough insulin to keep your blood sugar levels normal. Type 2 diabetes is associated with various health complications such as neuropathy (nerve damage), glaucoma, cataracts and various skin disorders. Early detection of diabetes is crucial to proper treatment so as to alleviate complications. The dataset Diabetes.txt contains information on 768 women who are at risk for diabetes. The dataset contains the following variables Variable Name Description pregnant glucose Number of times pregnant Plasma glucose concentration at 2 hours in an oral glucose tolerance test Diastolic blood pressure (mm Hg) Triceps skin fold thickness (mm) 2 hour serum insulin (mu U/ml) Body mass index Numeric strength of diabetes in family line (higher numbers mean stronger history) Age Does patient have diabetes (0 if "No", 1 if"Yes" diastolic triceps nsulin bmi pedigree age diabetes Doctors hope to use the covariate information to diagnose if a patient has diabetes or not. Note: many of the observations in this dataset contain values that can't occur (e.g. a BMI of 0). You will need to clean the dataset prior to your analysis In your own words, summarize the overarching problem. Discuss how predictive modeling will be able to answer the posed questions regarding diabetes. (5 points) a. b. Explore the data using basic exploratory graphics and summary statistics. Include scatterplots with smeeth curves to show the relationship between 2 covariates and the response (diabetes) Comment on any potential relationships you see through this exploratory analysis. Explain why traditional multiple linear regression methods are not suitable for this problem. (5 points) g. Use a decision tree algorithm for the purpose to classify diabetic cases What is the AUC statistics for your Decision Tree method_ Fill the confusion matrix below using DT method. Make a recommendation about which model is better for use in predictions. (5 points) Confusion Matrix Actual Outcome Model Prediction TP: FN; TN: h. Which variables are used in the Decision Tree? List them. (5 points) EXTRA CREDIT (10 points) Prune the decision tree you constructed in part g. List the variables used in the pruned decision tree classification and report the AUC for this decision tree