Use R studio to solve this . Thank for any help
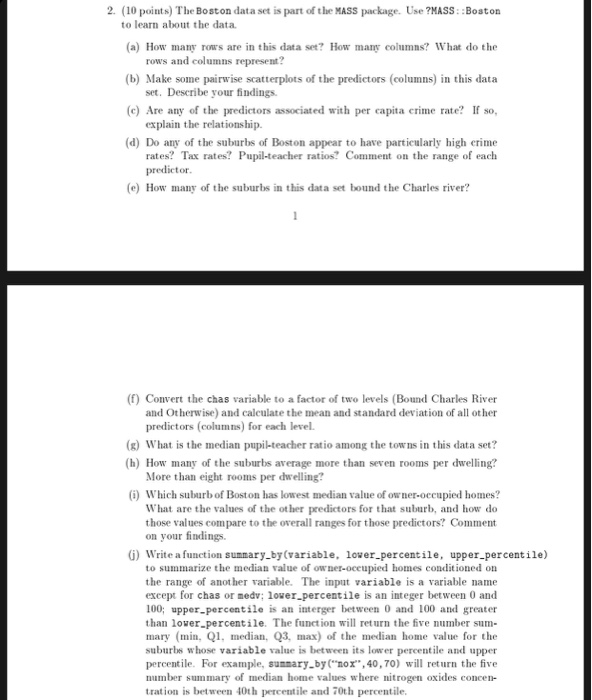
2. (10 points) The Boston data set is part of the MASS package. Use ?MASS: :Boston (a) How many rows are in this data set? How many columns? What do the pairwise scatterplots of the predictors (columns) in this data (c) Are any of the predictors associated with per capita crime rate? If so, (d) Do any of the suburbs of Boston appear to have particularly high erime to learn about the data. rows and columns represent? set. Describe your findings explain the relationship. (b) Make some rates? Tax rates? Pupil-teacher ratios? Comment on the range of each predictor e How many of the suburbs in this data set bound the Charles river? (f) Convert the chas variable to a factor of two levels (Bound Charles River and Otherwise) and calculate the mean and standard deviation of all other predictors (columns) for each level. (g) What is the median pupil-teacher ratio among the towns in this data set? (h) How many of the suburbs average more than seven rooms per dwelling? More than eight rooms per dwelling? ) Which suburb of Boston has lowest median value of owner-occupied homes? What are the values of the other predictors for that suburb, andhw do those values compare to the overall ranges for those predictors? Comment on your findings. G) Write a function summary by(variable, lower-percentile, upper .percentile) to summarize the median value of owner-oceupied homes conditioned on the range of another variable. The input variable is a variable name except for chas or medv; lower percentile is an integer between 0 and 100; upper percentile is an interger between 0 and 100 and greater than lover.percentile. The function will ret urn the five number sum- mary (min, Q1, median, Q3, max) of the median home value for the suburbs whose variable value is between its lower percentile and upper percentile. For example, sumnary_by(nox",40,70) will return the five number summary of median home values where nitrogen oxides conen tration is between 40th percentile and 70th percentile 2. (10 points) The Boston data set is part of the MASS package. Use ?MASS: :Boston (a) How many rows are in this data set? How many columns? What do the pairwise scatterplots of the predictors (columns) in this data (c) Are any of the predictors associated with per capita crime rate? If so, (d) Do any of the suburbs of Boston appear to have particularly high erime to learn about the data. rows and columns represent? set. Describe your findings explain the relationship. (b) Make some rates? Tax rates? Pupil-teacher ratios? Comment on the range of each predictor e How many of the suburbs in this data set bound the Charles river? (f) Convert the chas variable to a factor of two levels (Bound Charles River and Otherwise) and calculate the mean and standard deviation of all other predictors (columns) for each level. (g) What is the median pupil-teacher ratio among the towns in this data set? (h) How many of the suburbs average more than seven rooms per dwelling? More than eight rooms per dwelling? ) Which suburb of Boston has lowest median value of owner-occupied homes? What are the values of the other predictors for that suburb, andhw do those values compare to the overall ranges for those predictors? Comment on your findings. G) Write a function summary by(variable, lower-percentile, upper .percentile) to summarize the median value of owner-oceupied homes conditioned on the range of another variable. The input variable is a variable name except for chas or medv; lower percentile is an integer between 0 and 100; upper percentile is an interger between 0 and 100 and greater than lover.percentile. The function will ret urn the five number sum- mary (min, Q1, median, Q3, max) of the median home value for the suburbs whose variable value is between its lower percentile and upper percentile. For example, sumnary_by(nox",40,70) will return the five number summary of median home values where nitrogen oxides conen tration is between 40th percentile and 70th percentile