Answered step by step
Verified Expert Solution
Question
1 Approved Answer
Use R to answer this question. Please show your codes and output in R. Measurements of properties of pulp fibers and the paper made from


Use R to answer this question. Please show your codes and output in R.
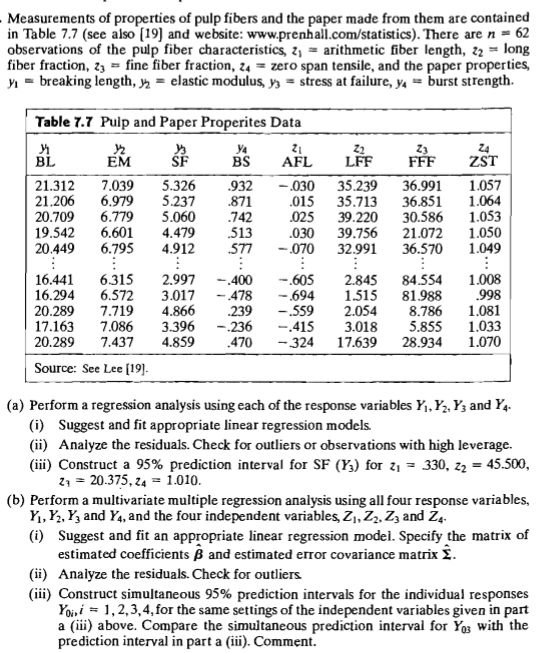
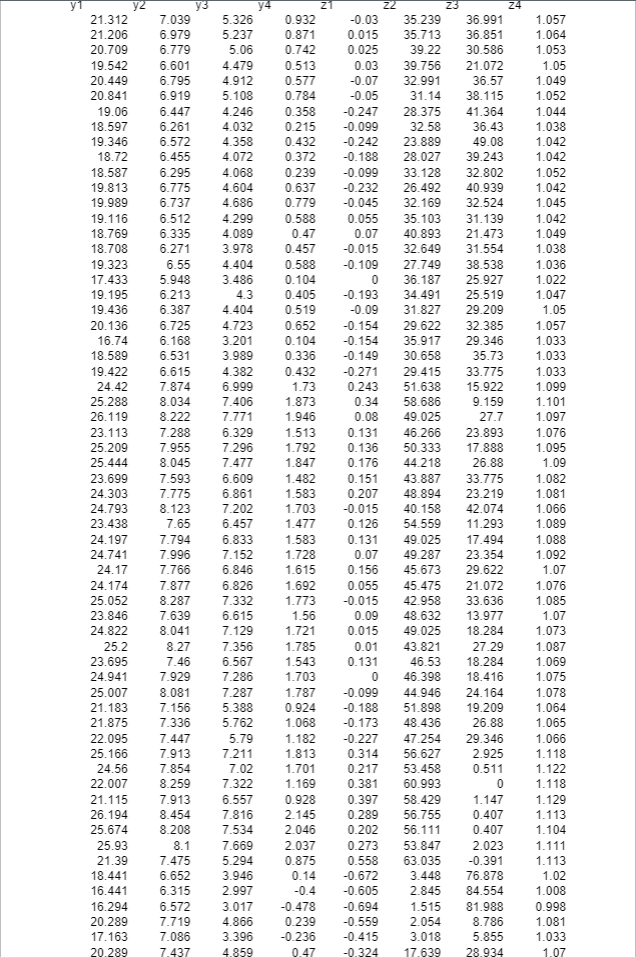
Measurements of properties of pulp fibers and the paper made from them are contained in Table 7.7 (see also (19) and website: www.prenhall.com/statistics). There are n = 62 observations of the pulp fiber characteristics, 2; = arithmetic fiber length, 22 = long fiber fraction, 2z = fine fiber fraction, 24 = zero span tensile, and the paper properties, 11 - breaking length, y = elastic modulus, y3 = stress at failure, ya = burst strength. Table 7.7 Pulp and Paper Properites Data 22 > y4 21 BL EM SF BS AFL 21.312 7.039 5.326 .932 -.030 21.206 6.979 5.237 .871 .015 20.709 6.779 5.060 .742 .025 19.542 6.601 4.479 .513 .030 20.449 6.795 4.912 577 - 070 LFF 35.239 35.713 39.220 39.756 32.991 Z3 FFF 36.991 36.851 30.586 21.072 36.570 24 ZST 1.057 1.064 1.053 1.050 1.049 : 1.008 .998 1.081 1.033 1.070 16.441 6.315 16.294 6.572 20.289 7.719 17.163 7.086 20.289 7.437 Source: See Lee (19) 2.997 3.017 4.866 3.396 4.859 -.400 -.478 .239 - 236 .470 -605 -.694 -559 -.415 - 324 2.845 1.515 2.054 3.018 17.639 84.554 81.988 8.786 5.855 28.934 (a) Perform a regression analysis using each of the response variables Y , Yz, Y; and Y4- (i) Suggest and fit appropriate linear regression models. (ii) Analyze the residuals. Check for outliers or observations with high leverage. (iii) Construct a 95% prediction interval for SF (Y3) for 21 = 330, 22 = 45.500, 27 = 20.375,24 = 1.010. (b) Perform a multivariate multiple regression analysis using all four response variables, Y., Yz, Y, and Ys, and the four independent variables, 21, 22, 23 and 2, (i) Suggest and fit an appropriate linear regression model. Specify the matrix of estimated coefficients and estimated error covariance matrix . (ii) Analyze the residuals. Check for outliers (iii) Construct simultaneous 95% prediction intervals for the individual responses Yoji = 1,2,3,4, for the same settings of the independent variables given in part a (iii) above. Compare the simultaneous prediction interval for Yo with the prediction interval in part a (iii). Comment. YZ 21.312 21.206 20.709 19.542 20.449 20.841 19.06 18.597 19.346 18.72 18.587 19.813 19.989 19.116 18.769 18.708 19.323 17.433 19.195 19.436 20.136 16.74 18.589 19.422 24.42 25.288 26.119 23.113 25.209 25.444 23.699 24.303 24.793 23.438 24.197 24.741 24.17 24.174 25.052 23.846 24.822 25.2 23.695 24.941 25.007 21.183 21.875 22.095 25.166 24.56 22.007 21.115 26.194 25.674 25.93 21.39 18.441 16.441 16.294 20.289 17.163 20.289 y. 7.039 6.979 6.779 6.601 6.795 6.919 6.447 6.261 6.572 6.455 6.295 6.775 6.737 6.512 6.335 6.271 6.55 5.948 6.213 6.387 6.725 6.168 6.531 6.615 7.874 8.034 8.222 7.288 7.955 8.045 7.593 7.775 8.123 7.65 7.794 7.996 7.766 7.877 8.287 7.639 8.041 8.27 7.46 7.929 8.081 7.156 7.336 7.447 7.913 7.854 8.259 7.913 8.454 8.208 8.1 7.475 6.652 6.315 6.572 7.719 7.086 7.437 5.326 5.237 5.06 4.479 4.912 5.108 4.246 4.032 4.358 4.072 4.068 4.604 4.686 4.299 4.089 3.978 4.404 3.486 43 4.404 4.723 3.201 3.989 4.382 6.999 7.406 7.771 6.329 7.296 7.477 6.609 6.861 7.202 6.457 6.833 7.152 6.846 6.826 7.332 6.615 7.129 7.356 6.567 7.286 7.287 5.388 5.762 5.79 7.211 7.02 7.322 6.557 7.816 7.534 7.669 5.294 3.946 2.997 3.017 4.866 3.396 4.859 0.932 0.871 0.742 0.513 0.577 0.784 0.358 0.215 0.432 0.372 0.239 0.637 0.779 0.588 0.47 0.457 0.588 0.104 0.405 0.519 0.652 0.104 0.336 0.432 1.73 1.873 1.946 1.513 1.792 1.847 1.482 1.583 1.703 1.477 1.583 1.728 1.615 1.692 1.773 1.56 1.721 1.785 1.543 1.703 1.787 0.924 1.068 1.182 1.813 1.701 1.169 0.928 2.145 2.046 2.037 0.875 0.14 -0.4 -0.478 0.239 -0.236 0.47 22 23 24 -0.03 35.239 36.991 0.015 35.713 36.851 0.025 39.22 30.586 0.03 39.756 21.072 -0.07 32.991 36.57 -0.05 31.14 38.115 -0.247 28.375 41.364 -0.099 32.58 36.43 -0.242 23.889 49.08 -0.188 28.027 39.243 -0.099 33.128 32.802 -0.232 26.492 40.939 -0.045 32. 169 32.524 0.055 35.103 31.139 0.07 40.893 21.473 -0.015 32.649 31.554 -0.109 27.749 38.538 0 36.187 25.927 -0.193 34.491 25.519 -0.09 31.827 29.209 -0.154 29.622 32.385 -0.154 35.917 29.346 -0.149 30.658 35.73 -0.271 29.415 33.775 0.243 51.638 15.922 0.34 58.686 9.159 0.08 49.025 27.7 0.131 46.266 23.893 0.136 50.333 17.888 0.176 44.218 26.88 0.151 43.887 33.775 0.207 48.894 23.219 -0.015 40.158 42.074 0.126 54.559 11.293 0.131 49.025 17.494 0.07 49.287 23.354 0.156 45.673 29.622 0.055 45.475 21.072 -0.015 42.958 33.636 0.09 48.632 13.977 0.015 49.025 18.284 0.01 43.821 27.29 0.131 46.53 18.284 0 46.398 18.416 -0.099 44.946 24.164 -0.188 51.898 19.209 -0.173 48.436 26.88 -0.227 47.254 29.346 0.314 56.627 2.925 0.217 53.458 0.511 0.381 60.993 0 0.397 58.429 1.147 0.289 56.755 0.407 0.202 56.111 0.407 0.273 53.847 2.023 0.558 63.035 -0.391 -0.672 3.448 76.878 -0.605 2.845 84.554 -0.694 1.515 81.988 -0.559 2.054 8.786 -0.415 3.018 5.855 -0.324 17.639 28.934 1.057 1.064 1.053 1.05 1.049 1.052 1.044 1.038 1.042 1.042 1.052 1.042 1.045 1.042 1.049 1.038 1.036 1.022 1.047 1.05 1.057 1.033 1.033 1.033 1.099 1.101 1.097 1.076 1.095 1.09 1.082 1.081 1.066 1.089 1.088 1.092 1.07 1.076 1.085 1.07 1.073 1.087 1.069 1.075 1.078 1.064 1.065 1.066 1.118 1.122 1.118 1.129 1.113 1.104 1.111 1.113 1.02 1.008 0.998 1.081 1.033 1.07Step by Step Solution
There are 3 Steps involved in it
Step: 1

Get Instant Access to Expert-Tailored Solutions
See step-by-step solutions with expert insights and AI powered tools for academic success
Step: 2

Step: 3

Ace Your Homework with AI
Get the answers you need in no time with our AI-driven, step-by-step assistance
Get Started


