Answered step by step
Verified Expert Solution
Question
1 Approved Answer
Use ratio analyses to assess and compare liquidity position and market value of dollar company over two years. Financial information of the Dollar Company for
Use ratio analyses to assess and compare liquidity position and market value of dollar company over two years.


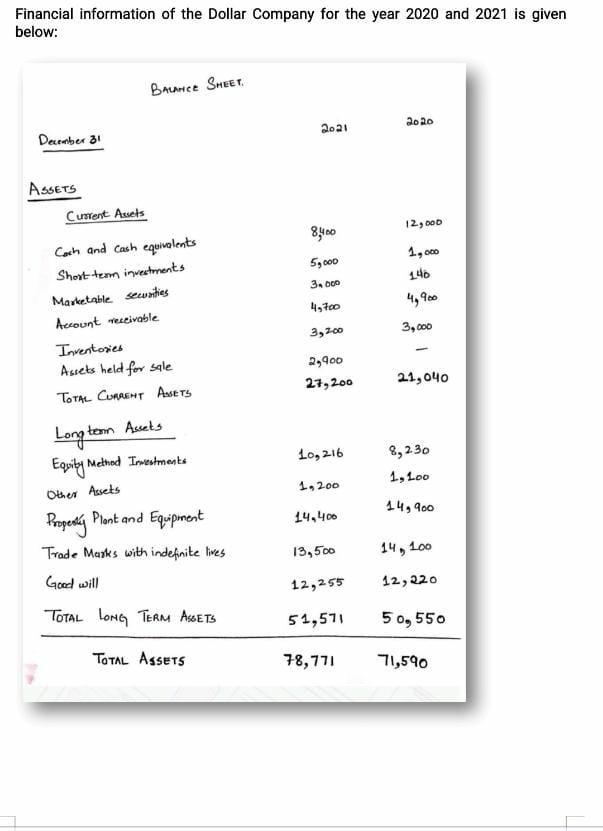
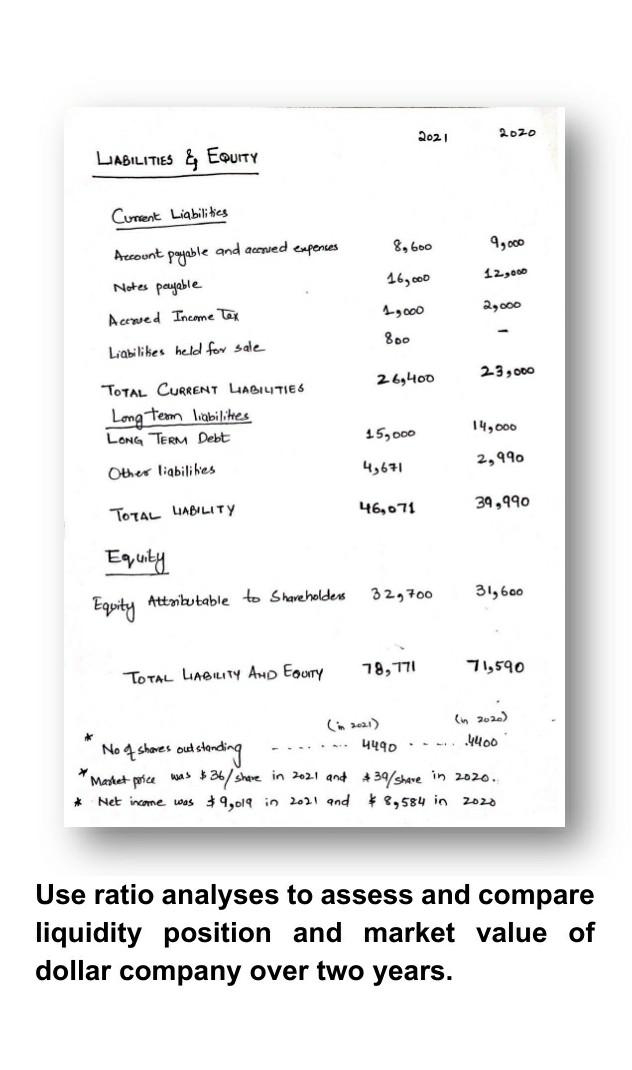
Financial information of the Dollar Company for the year 2020 and 2021 is given below: Bounce Sheet 2010 2021 December 31 ASSETS Current Assets 12,00 8400 5,000 1,000 3.000 146 4,900 Cosh and Cash equivalents Short term investments Marketable sewnities Account eseivable Inventories Assets held for sale TOTAL CURRENT Assets 49700 3,700 3,000 2,900 27,200 21,040 Long term Aucts 10,216 Equity Melted Investments 8,230 1,100 1,200 Other Assets 14,900 14,400 13,500 14,100 Property Plant and Equipment Trade Marks with indefinite lives Good will TOTAL LONG TERM Assets 12,255 12,220 51,571 50, 550 TOTAL ASSETS 78,771 71,590 Rozo 2021 2020 LIABILITIES EQUITY Current Liabilities 8,600 9,000 Account payable and aupued expenses 16,000 Notes payable 12,000 2,000 Aceved Income tex 1,000 800 Liabilikes held for sale 26,400 23,000 TOTAL CURRENT LABILITIES Long term Irabilites LONG TERM Debt 15,000 14,000 2,990 Other liabilihes 49671 46,071 39,990 TOTAL LIABILITY Equity Equity Attributable to shareholders 32,700 31,600 ,8 71,590 TOTAL LIABILITY AND Egurry in 2020 No q shores outstanding 4490 .4400 Market price was $36/ share in 2021 and $39/ share in 2020. Net income was $4,019 in 2021 and $8,584 in 2020 Use ratio analyses to assess and compare liquidity position and market value of dollar company over two years
Step by Step Solution
There are 3 Steps involved in it
Step: 1

Get Instant Access to Expert-Tailored Solutions
See step-by-step solutions with expert insights and AI powered tools for academic success
Step: 2

Step: 3

Ace Your Homework with AI
Get the answers you need in no time with our AI-driven, step-by-step assistance
Get Started


