

Question
USE RSTUDIO TO ANSWER THE FOLLOWING QUESTIONS. PRESENT R CODES AND SCREENSHOTS OF EVERY OUTPUT WITH THE CODE AND ASSIGN THE QUESTION NUMBER TO THE


USE RSTUDIO TO ANSWER THE FOLLOWING QUESTIONS. PRESENT R CODES AND SCREENSHOTS OF EVERY OUTPUT WITH THE CODE AND ASSIGN THE QUESTION NUMBER TO THE ANSWER.
Question 1 to 4 has been answered. I JUST NEED HELP ON QUESTIONS 5 TO 8
DATA SET IS HERE: https://docs.google.com/spreadsheets/d/1fthpWnzxx4vljWjuZIzSU4_ShpfzdHMl/edit?usp=sharing&ouid=101981614875951507390&rtpof=true&sd=true
Use the attached dataset HomesforSale.xls which contains a random sample of home prices in 4 different states with 120 observations on the following 5 variables.
State | Location of the home:CANJNYPA |
Price | Asking price (in $1,000's) |
Size | Area of all rooms (in 1,000's sq. ft.) |
Beds | Number of bedrooms |
Baths | Number of bathrooms |
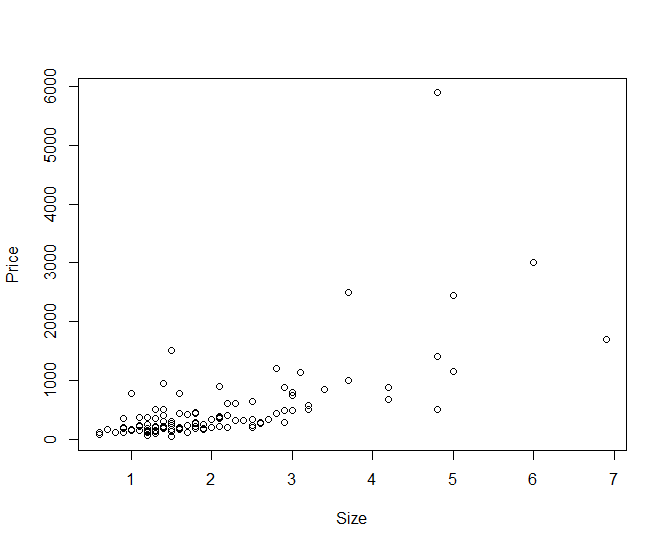
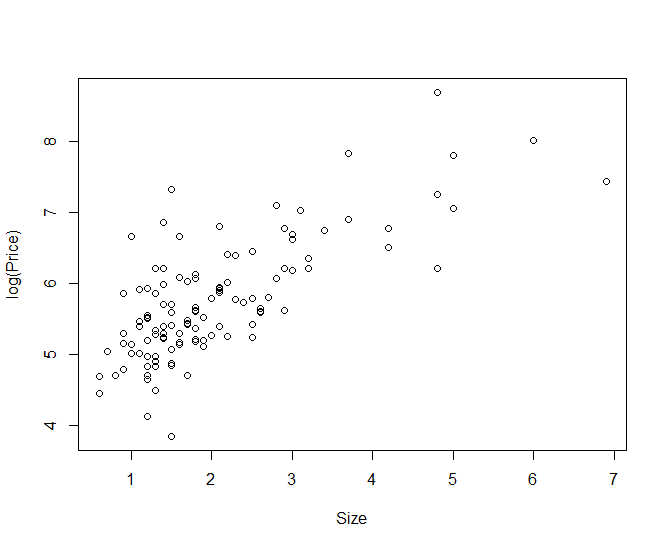
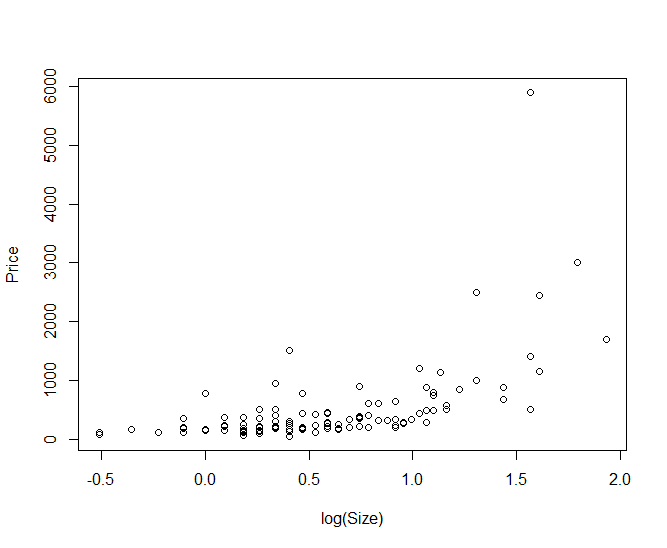
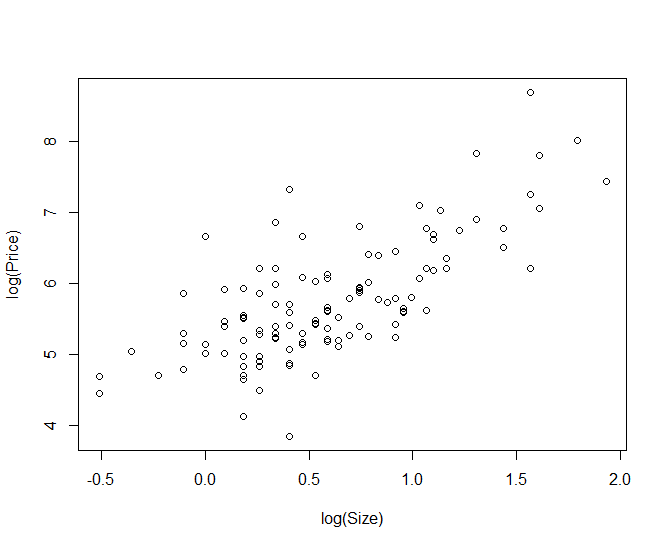
1. Make a scatterplot of Price and Size and justify an appropriate model using log transformation for these 2 variables (add the graphs on your PDF submission). Which transformation works better for a model with these 2 variables (log-lin/ lin-log/ log-log, use these options, be careful with typos).
> HomesforSale_1_
> View(HomesforSale_1_)
> attach(HomesforSale_1_)
The following objects are masked from HomesforSale_1_ (pos = 3):
Baths, Beds, Price, Size, State
> plot(Price~Size)

Step by Step Solution
There are 3 Steps involved in it
Step: 1

Get Instant Access to Expert-Tailored Solutions
See step-by-step solutions with expert insights and AI powered tools for academic success
Step: 2

Step: 3
Ace Your Homework with AI
Get the answers you need in no time with our AI-driven, step-by-step assistance
Get Started
College Algebra And Trigonometry A Unit Circle Approach,
Authors: Mark Dugopolski
5th Edition
0321908252, 9780321908254