Use Sheet 3 to complete 4 & 5 missing items
sheet 3
sheet 4
sheet 5
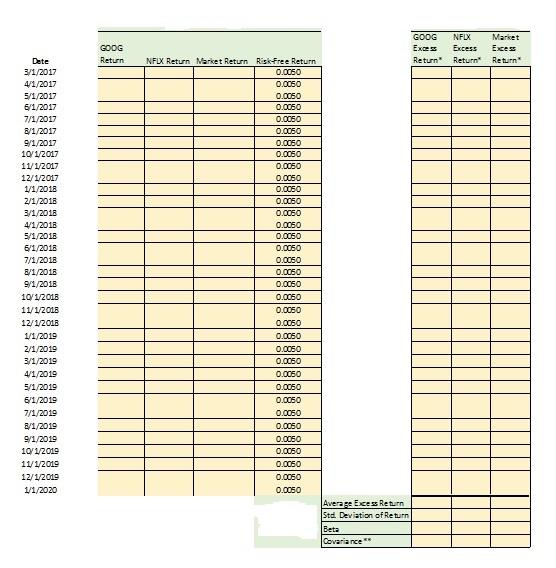
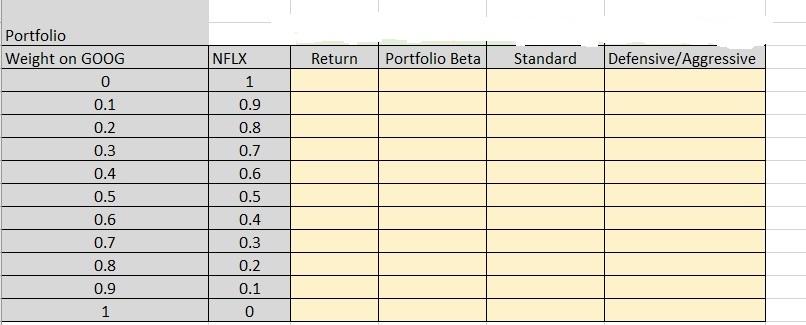
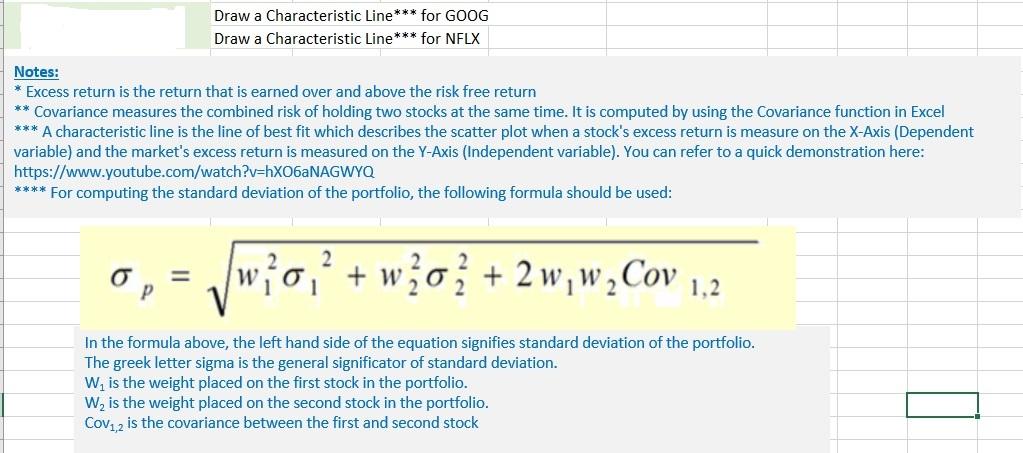
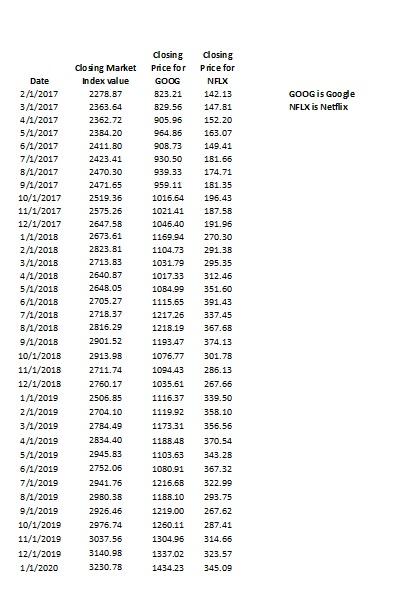
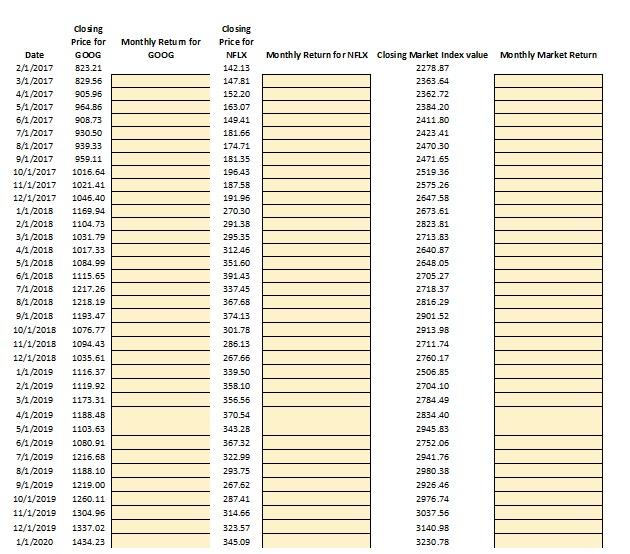
GOOG is Google NFLX is Netflix Date 2/1/2017 3/1/2017 4/1/2017 5/1/2017 6/1/2017 7/1/2017 B/1/2017 9/1/2017 10/1/2017 11/1/2017 12/1/2017 1/1/2018 2/1/2018 3/1/2018 4/1/2018 5/1/2018 6/1/2018 7/1/2018 B/1/2018 9/1/2018 10/1/2018 11/1/2018 12/1/2018 1/1/2019 2/1/2019 3/1/2019 4/1/2019 5/1/2019 6/1/2019 7/1/2019 8/1/2019 9/1/2019 10/1/2019 11/1/2019 12/1/2019 1/1/2020 closing Market Index value 2278.87 2363.64 2362.72 2384.20 2411.80 2423.41 2470.30 2471.65 2519.36 2575.26 2647.58 2673.61 2823.81 2713.63 2640.87 2648.05 2705.27 2718.37 2816.29 2901.52 2913.98 2711.74 2760.17 2505.85 2704.10 2784.49 2834.40 2945.83 2752.05 2941.75 2980.38 2926.46 2976.74 3037.56 3140.98 3230.78 closing Price for GOOG B23.21 829.56 905.95 964.86 906.73 930.50 939.33 959.11 1016.64 1021.41 1045.40 1169.94 1104.73 1031.79 1017.33 1014.99 1115.55 1217.26 1218.19 1193.47 1076.77 1094.43 1035.61 1116.37 1119.92 1173.31 1188.48 1103.63 1080.91 1216.68 1188.10 1219.00 closing Price for NFLX 142.13 147.81 152.20 163.07 149.41 181.66 174.71 181.35 196.43 187.58 191.96 270.30 291.38 295.35 312.45 351.60 391.43 337.45 367.68 374.13 301.78 286.13 267.66 339.50 358.10 356.56 370.54 343.28 367.32 322.99 293.75 267.62 1260.11 1304.95 1337.02 1434.23 287.41 314.66 323.57 345.09 Monthly Retum for GOOG Date 2/1/2017 3/1/2017 4/1/2017 5/1/2017 6/1/2017 7/1/2017 B/1/2017 9/1/2017 10/1/2017 11/1/2017 12/1/2017 1/1/2018 2/1/2018 3/1/2018 4/1/2018 5/1/2018 6/1/2018 7/1/2018 8/1/2018 9/1/2018 10/1/2018 11/1/2018 12/1/2018 1/1/2019 2/1/2019 3/1/2019 4/1/2019 5/1/2019 6/1/2019 7/1/2019 B/1/2019 9/1/2019 10/1/2019 11/1/2019 12/1/2019 1/1/2020 closing Price for GOOG 823.21 829.56 905.96 964.86 908.73 930.50 939.33 959.11 1015.64 1021.41 1046.40 1169.94 1104.73 1031.79 1017.33 1084.99 1115.65 1217.26 1216.19 1193.47 1076.77 1094.43 1035.61 1116.37 1119.92 1173.31 1188.48 1103.63 1080.91 1216.68 1168.10 1219.00 1260.11 1304.96 1337.02 1434, 23 closing Price for NFLX 142.13 147.81 152.20 163.07 149.41 181.66 174.71 181.35 196.43 187.56 191.96 270.30 291.38 295.35 312.46 351.60 391.43 337.45 367.68 374.13 301.78 286.13 267.66 339.50 358.10 356.56 Monthly Return for NFLX Closing Market Index value Monthly Market Return 2278.67 2363.54 2362.72 2384.20 2411.30 2423 41 2470.30 2471.65 2519.36 2575.26 2647.58 2673.61 2823.81 2713.63 2640.67 2648.05 2705.27 2718.37 2616.29 2901 52 2913.98 2711.74 2760.17 2506.85 2704.10 2784.49 2834.40 2945.83 2752.06 2941.76 2980.38 2926.46 2976.74 3037.56 3140.98 3230.78 370.54 343.28 367.32 322.99 293.75 267.62 28741 314.66 323.57 345.09 GOOG Return NFLX Excess Return Market Excess Return Dete 3/1/2017 4/1/2017 5/1/2017 6/1/2017 7/11/2017 8/1/2017 9/1/2017 10/1/2017 11/1/2017 12/1/2017 1/1/2018 2/1/2018 3/1/2018 4/1/2018 5/1/2018 6/1/2018 7/1/2018 8/1/2018 9/1/2018 10/1/2018 11/1/2018 12/1/2018 1/1/2019 2/1/2019 3/1/2019 4/1/2019 5/1/2019 6/1/2019 7/1/2019 8/1/2019 9/1/2019 10/1/2019 11/1/2019 12/1/2010 1/1/2020 GOOG Excess NFLX Return Market Return Risk Free Return Return 0.0050 0.0050 0.0050 0.0050 0.0050 0.0050 0.0050 0.0050 0.0050 0.0050 0.0050 0.0050 0.0050 0.0050 0.0050 0.0050 0.0050 0.0050 0.0050 0.0050 0.0050 0.0050 0.0050 0.0050 0.0050 0.0050 0.0050 0.0050 0.0050 0.0050 0.0050 0.0050 0.0050 0.0050 0.0050 Averare Excess Return Std. Deviation of Return Beta Covariance Return Portfolio Beta Standard Defensive/Aggressive Portfolio Weight on GOOG 0 0.1 0.2 0.3 0.4 0.5 0.6 0.7 0.8 0.9 NFLX 1 0.9 0.8 0.7 0.6 0.5 0.4 0.3 0.2 0.1 0 1 Draw a Characteristic Line*** for GOOG Draw a Characteristic Line*** for NFLX Notes: * Excess return is the return that is earned over and above the risk free return ** Covariance measures the combined risk of holding two stocks at the same time. It is computed by using the Covariance function in Excel *** A characteristic line is the line of best fit which describes the scatter plot when a stock's excess return is measure on the X-Axis (Dependent variable) and the market's excess return is measured on the Y-Axis (Independent variable). You can refer to a quick demonstration here: https://www.youtube.com/watch?v=hxO6aNAGWYQ **** For computing the standard deviation of the portfolio, the following formula should be used: 2 2 = P wo' wo , + wzo + 2 w,w, Cov 1,2 2 In the formula above, the left hand side of the equation signifies standard deviation of the portfolio. The greek letter sigma is the general significator of standard deviation. W is the weight placed on the first stock in the portfolio. W, is the weight placed on the second stock in the portfolio. Cov1,2 is the covariance between the first and second stock GOOG is Google NFLX is Netflix Date 2/1/2017 3/1/2017 4/1/2017 5/1/2017 6/1/2017 7/1/2017 B/1/2017 9/1/2017 10/1/2017 11/1/2017 12/1/2017 1/1/2018 2/1/2018 3/1/2018 4/1/2018 5/1/2018 6/1/2018 7/1/2018 B/1/2018 9/1/2018 10/1/2018 11/1/2018 12/1/2018 1/1/2019 2/1/2019 3/1/2019 4/1/2019 5/1/2019 6/1/2019 7/1/2019 8/1/2019 9/1/2019 10/1/2019 11/1/2019 12/1/2019 1/1/2020 closing Market Index value 2278.87 2363.64 2362.72 2384.20 2411.80 2423.41 2470.30 2471.65 2519.36 2575.26 2647.58 2673.61 2823.81 2713.63 2640.87 2648.05 2705.27 2718.37 2816.29 2901.52 2913.98 2711.74 2760.17 2505.85 2704.10 2784.49 2834.40 2945.83 2752.05 2941.75 2980.38 2926.46 2976.74 3037.56 3140.98 3230.78 closing Price for GOOG B23.21 829.56 905.95 964.86 906.73 930.50 939.33 959.11 1016.64 1021.41 1045.40 1169.94 1104.73 1031.79 1017.33 1014.99 1115.55 1217.26 1218.19 1193.47 1076.77 1094.43 1035.61 1116.37 1119.92 1173.31 1188.48 1103.63 1080.91 1216.68 1188.10 1219.00 closing Price for NFLX 142.13 147.81 152.20 163.07 149.41 181.66 174.71 181.35 196.43 187.58 191.96 270.30 291.38 295.35 312.45 351.60 391.43 337.45 367.68 374.13 301.78 286.13 267.66 339.50 358.10 356.56 370.54 343.28 367.32 322.99 293.75 267.62 1260.11 1304.95 1337.02 1434.23 287.41 314.66 323.57 345.09 Monthly Retum for GOOG Date 2/1/2017 3/1/2017 4/1/2017 5/1/2017 6/1/2017 7/1/2017 B/1/2017 9/1/2017 10/1/2017 11/1/2017 12/1/2017 1/1/2018 2/1/2018 3/1/2018 4/1/2018 5/1/2018 6/1/2018 7/1/2018 8/1/2018 9/1/2018 10/1/2018 11/1/2018 12/1/2018 1/1/2019 2/1/2019 3/1/2019 4/1/2019 5/1/2019 6/1/2019 7/1/2019 B/1/2019 9/1/2019 10/1/2019 11/1/2019 12/1/2019 1/1/2020 closing Price for GOOG 823.21 829.56 905.96 964.86 908.73 930.50 939.33 959.11 1015.64 1021.41 1046.40 1169.94 1104.73 1031.79 1017.33 1084.99 1115.65 1217.26 1216.19 1193.47 1076.77 1094.43 1035.61 1116.37 1119.92 1173.31 1188.48 1103.63 1080.91 1216.68 1168.10 1219.00 1260.11 1304.96 1337.02 1434, 23 closing Price for NFLX 142.13 147.81 152.20 163.07 149.41 181.66 174.71 181.35 196.43 187.56 191.96 270.30 291.38 295.35 312.46 351.60 391.43 337.45 367.68 374.13 301.78 286.13 267.66 339.50 358.10 356.56 Monthly Return for NFLX Closing Market Index value Monthly Market Return 2278.67 2363.54 2362.72 2384.20 2411.30 2423 41 2470.30 2471.65 2519.36 2575.26 2647.58 2673.61 2823.81 2713.63 2640.67 2648.05 2705.27 2718.37 2616.29 2901 52 2913.98 2711.74 2760.17 2506.85 2704.10 2784.49 2834.40 2945.83 2752.06 2941.76 2980.38 2926.46 2976.74 3037.56 3140.98 3230.78 370.54 343.28 367.32 322.99 293.75 267.62 28741 314.66 323.57 345.09 GOOG Return NFLX Excess Return Market Excess Return Dete 3/1/2017 4/1/2017 5/1/2017 6/1/2017 7/11/2017 8/1/2017 9/1/2017 10/1/2017 11/1/2017 12/1/2017 1/1/2018 2/1/2018 3/1/2018 4/1/2018 5/1/2018 6/1/2018 7/1/2018 8/1/2018 9/1/2018 10/1/2018 11/1/2018 12/1/2018 1/1/2019 2/1/2019 3/1/2019 4/1/2019 5/1/2019 6/1/2019 7/1/2019 8/1/2019 9/1/2019 10/1/2019 11/1/2019 12/1/2010 1/1/2020 GOOG Excess NFLX Return Market Return Risk Free Return Return 0.0050 0.0050 0.0050 0.0050 0.0050 0.0050 0.0050 0.0050 0.0050 0.0050 0.0050 0.0050 0.0050 0.0050 0.0050 0.0050 0.0050 0.0050 0.0050 0.0050 0.0050 0.0050 0.0050 0.0050 0.0050 0.0050 0.0050 0.0050 0.0050 0.0050 0.0050 0.0050 0.0050 0.0050 0.0050 Averare Excess Return Std. Deviation of Return Beta Covariance Return Portfolio Beta Standard Defensive/Aggressive Portfolio Weight on GOOG 0 0.1 0.2 0.3 0.4 0.5 0.6 0.7 0.8 0.9 NFLX 1 0.9 0.8 0.7 0.6 0.5 0.4 0.3 0.2 0.1 0 1 Draw a Characteristic Line*** for GOOG Draw a Characteristic Line*** for NFLX Notes: * Excess return is the return that is earned over and above the risk free return ** Covariance measures the combined risk of holding two stocks at the same time. It is computed by using the Covariance function in Excel *** A characteristic line is the line of best fit which describes the scatter plot when a stock's excess return is measure on the X-Axis (Dependent variable) and the market's excess return is measured on the Y-Axis (Independent variable). You can refer to a quick demonstration here: https://www.youtube.com/watch?v=hxO6aNAGWYQ **** For computing the standard deviation of the portfolio, the following formula should be used: 2 2 = P wo' wo , + wzo + 2 w,w, Cov 1,2 2 In the formula above, the left hand side of the equation signifies standard deviation of the portfolio. The greek letter sigma is the general significator of standard deviation. W is the weight placed on the first stock in the portfolio. W, is the weight placed on the second stock in the portfolio. Cov1,2 is the covariance between the first and second stock