use SPSS & XCELL
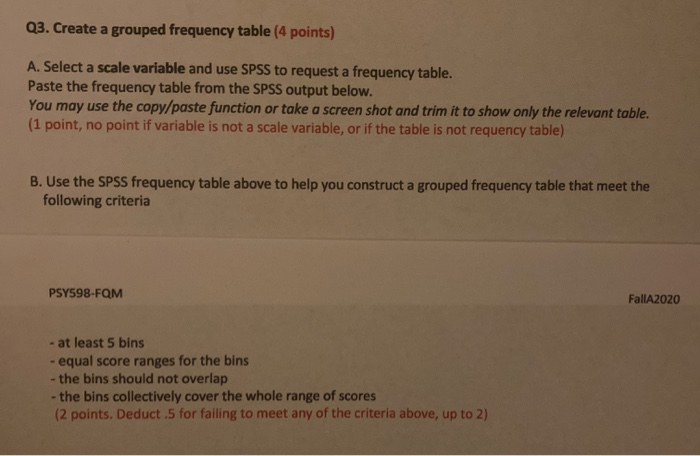
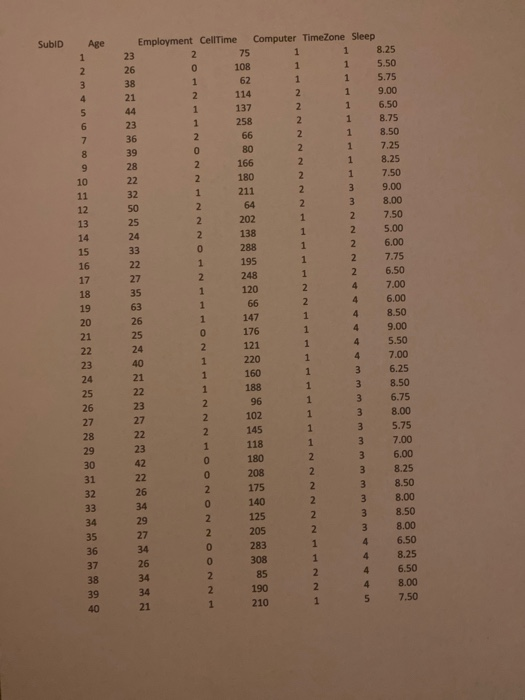
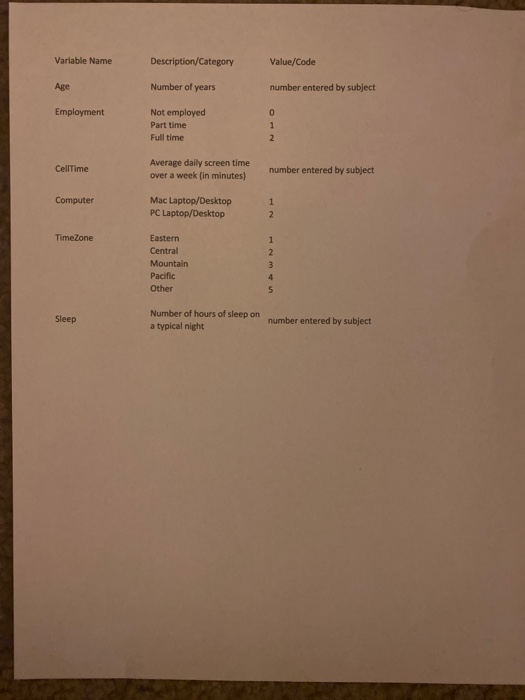
Q3. Create a grouped frequency table (4 points) A. Select a scale variable and use SPSS to request a frequency table. Paste the frequency table from the SPSS output below. You may use the copy/paste function or take a screen shot and trim it to show only the relevant table. (1 point, no point if variable is not a scale variable, or if the table is not requency table) B. Use the SPSS frequency table above to help you construct a grouped frequency table that meet the following criteria PSY598-FQM FallA2020 - at least 5 bins - equal score ranges for the bins - the bins should not overlap - the bins collectively cover the whole range of scores (2 points. Deduct.5 for failing to meet any of the criteria above, up to 2) SubID Age 1 2 3 4 s 6 7 8 9 10 11 12 13 14 15 16 17 18 19 20 21 22 23 24 25 26 17 28 29 30 31 32 33 34 35 36 37 38 39 40 Employment CellTime Computer TimeZone Sleep 23 1 75 1 1 8.25 26 0 108 1 1 5.50 38 1 62 1 1 575 21 2 14 2 1 5.00 44 1 137 1 6.50 23 258 1 1 8.75 36 1 66 2 1 8.50 39 0 B0 2 7,25 28 2 166 2 1 8.25 22 1 180 2 1 70 32 1 211 2 3 9.0 50 2 64 ? 3 8.00 25 2 202 1 2 7.50 24 2 138 2 5.00 33 0 288 1 2 6.00 22 1 195 1 2 7.75 27 2 14B 1 2 6.50 35 1 120 2 4 7.00 3 1 66 4 2 6.00 147 26 1 4 8.50 15 176 4 1 9.00 24 2 121 1. 4 5.50 40 1 220 1 7.00 21 1 160 1 3 6.25 1 22 188 3 1 8 50 23 2 96 1 3 6.75 27 2 102 1 3 8.00 22 2 145 1 3 5.75 23 1 118 1 3 7.00 0 180 2 42 6.00 3 22 0 208 3 8 25 26 2 175 2 3 8.50 34 0 140 2 3 8.00 29 1 125 2 3 8.50 17 2 105 ? 3 8.00 3 283 1 4 26 0 308 1 8.25 34 2 85 4 2 6.50 34 2 190 2 4 8 00 1 21 210 5 1 7.50 6 50 Variable Name Description/Category Value/Code Age Number of years number entered by subject Employment Not employed Part time Full time 0 1 2 CellTime Average daily screen time over a week (in minutes) number entered by subject Computer Mac Laptop/Desktop PC Laptop/Desktop 1 2 TimeZone 1 2. Eastern Central Mountain Pacific Other 3 4 5 Sleep Number of hours of sleep on a typical night number entered by subject Q3. Create a grouped frequency table (4 points) A. Select a scale variable and use SPSS to request a frequency table. Paste the frequency table from the SPSS output below. You may use the copy/paste function or take a screen shot and trim it to show only the relevant table. (1 point, no point if variable is not a scale variable, or if the table is not requency table) B. Use the SPSS frequency table above to help you construct a grouped frequency table that meet the following criteria PSY598-FQM FallA2020 - at least 5 bins - equal score ranges for the bins - the bins should not overlap - the bins collectively cover the whole range of scores (2 points. Deduct.5 for failing to meet any of the criteria above, up to 2) SubID Age 1 2 3 4 s 6 7 8 9 10 11 12 13 14 15 16 17 18 19 20 21 22 23 24 25 26 17 28 29 30 31 32 33 34 35 36 37 38 39 40 Employment CellTime Computer TimeZone Sleep 23 1 75 1 1 8.25 26 0 108 1 1 5.50 38 1 62 1 1 575 21 2 14 2 1 5.00 44 1 137 1 6.50 23 258 1 1 8.75 36 1 66 2 1 8.50 39 0 B0 2 7,25 28 2 166 2 1 8.25 22 1 180 2 1 70 32 1 211 2 3 9.0 50 2 64 ? 3 8.00 25 2 202 1 2 7.50 24 2 138 2 5.00 33 0 288 1 2 6.00 22 1 195 1 2 7.75 27 2 14B 1 2 6.50 35 1 120 2 4 7.00 3 1 66 4 2 6.00 147 26 1 4 8.50 15 176 4 1 9.00 24 2 121 1. 4 5.50 40 1 220 1 7.00 21 1 160 1 3 6.25 1 22 188 3 1 8 50 23 2 96 1 3 6.75 27 2 102 1 3 8.00 22 2 145 1 3 5.75 23 1 118 1 3 7.00 0 180 2 42 6.00 3 22 0 208 3 8 25 26 2 175 2 3 8.50 34 0 140 2 3 8.00 29 1 125 2 3 8.50 17 2 105 ? 3 8.00 3 283 1 4 26 0 308 1 8.25 34 2 85 4 2 6.50 34 2 190 2 4 8 00 1 21 210 5 1 7.50 6 50 Variable Name Description/Category Value/Code Age Number of years number entered by subject Employment Not employed Part time Full time 0 1 2 CellTime Average daily screen time over a week (in minutes) number entered by subject Computer Mac Laptop/Desktop PC Laptop/Desktop 1 2 TimeZone 1 2. Eastern Central Mountain Pacific Other 3 4 5 Sleep Number of hours of sleep on a typical night number entered by subject