Answered step by step
Verified Expert Solution
Question
1 Approved Answer
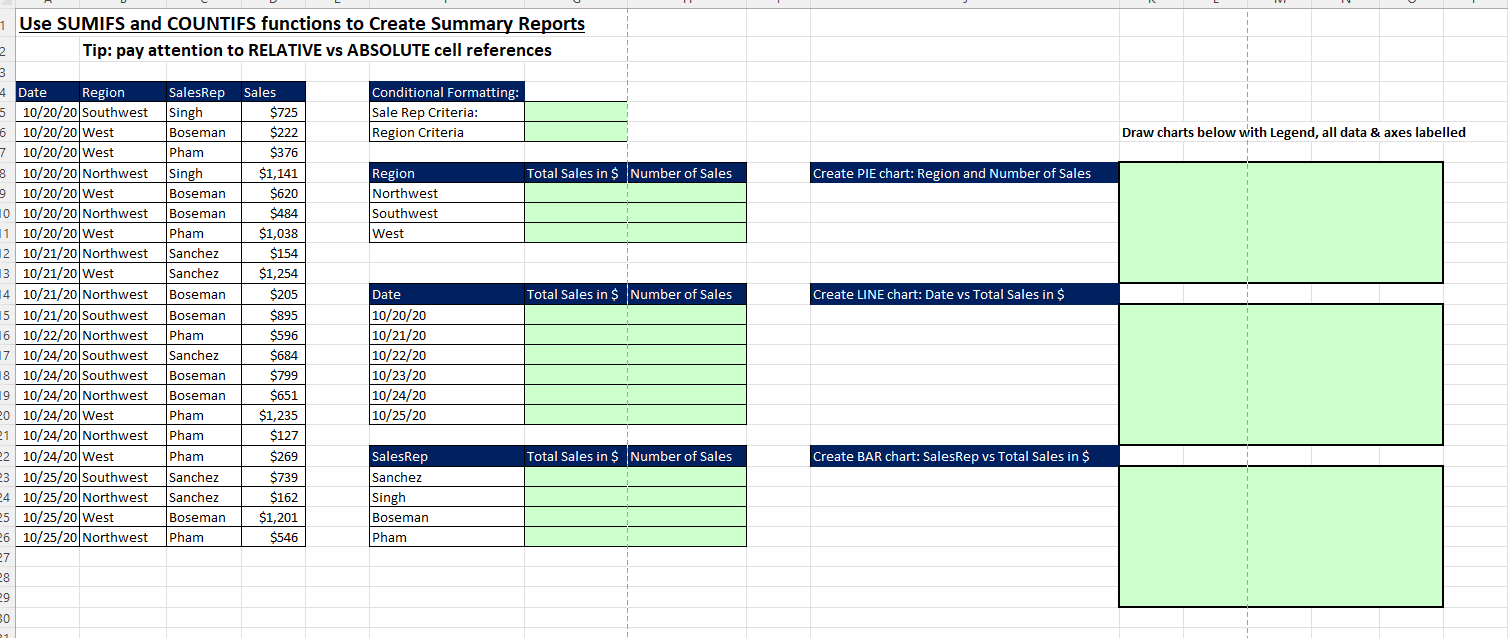
Use SUMIFS and COUNTIFS functions to Create Summary Reports Tip: pay attention to RELATIVE vs ABSOLUTE cell references begin{tabular}{|l|l|l|} hline Conditional Formatting: & hline
 Use SUMIFS and COUNTIFS functions to Create Summary Reports Tip: pay attention to RELATIVE vs ABSOLUTE cell references \begin{tabular}{|l|l|l|} \hline Conditional Formatting: & \\ \hline Sale Rep Criteria: & & \\ \hline Region Criteria & & \\ \hline Region & Total Sales in \$ & Number of Sales \\ \hline Northwest & & \\ \hline Southwest & & \\ \hline West & & \\ \hline & & \\ \hline Date & Total Sales in \$ & Number of Sales \\ \hline 10/20/20 & & \\ \hline 10/21/20 & & \\ \hline 10/22/20 & & \\ \hline 10/23/20 & & \\ \hline 10/24/20 & & \\ \hline 10/25/20 & & \\ \hline SalesRep & & \\ \hline Sanchez & & \\ \hline Singh & & \\ \hline Boseman & & \\ \hline Pham & & \\ \hline \end{tabular} Draw charts below with Legend, all data \& axes labelled Create PIE chart: Region and Number of Sales Create LINE chart: Date vs Total Sales in \$ Create BAR chart: SalesRep vs Total Sales in \$ Use SUMIFS and COUNTIFS functions to Create Summary Reports Tip: pay attention to RELATIVE vs ABSOLUTE cell references \begin{tabular}{|l|l|l|} \hline Conditional Formatting: & \\ \hline Sale Rep Criteria: & & \\ \hline Region Criteria & & \\ \hline Region & Total Sales in \$ & Number of Sales \\ \hline Northwest & & \\ \hline Southwest & & \\ \hline West & & \\ \hline & & \\ \hline Date & Total Sales in \$ & Number of Sales \\ \hline 10/20/20 & & \\ \hline 10/21/20 & & \\ \hline 10/22/20 & & \\ \hline 10/23/20 & & \\ \hline 10/24/20 & & \\ \hline 10/25/20 & & \\ \hline SalesRep & & \\ \hline Sanchez & & \\ \hline Singh & & \\ \hline Boseman & & \\ \hline Pham & & \\ \hline \end{tabular} Draw charts below with Legend, all data \& axes labelled Create PIE chart: Region and Number of Sales Create LINE chart: Date vs Total Sales in \$ Create BAR chart: SalesRep vs Total Sales in \$
 Step by Step Solution
There are 3 Steps involved in it
Step: 1

Get Instant Access to Expert-Tailored Solutions
See step-by-step solutions with expert insights and AI powered tools for academic success
Step: 2

Step: 3

Ace Your Homework with AI
Get the answers you need in no time with our AI-driven, step-by-step assistance
Get Started


