use table below for #5. SG&A table is above. be descriptive on how you got the answers please!
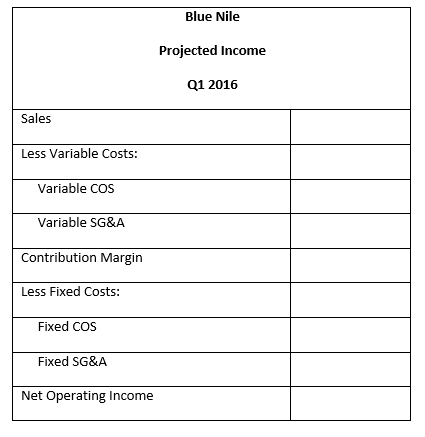
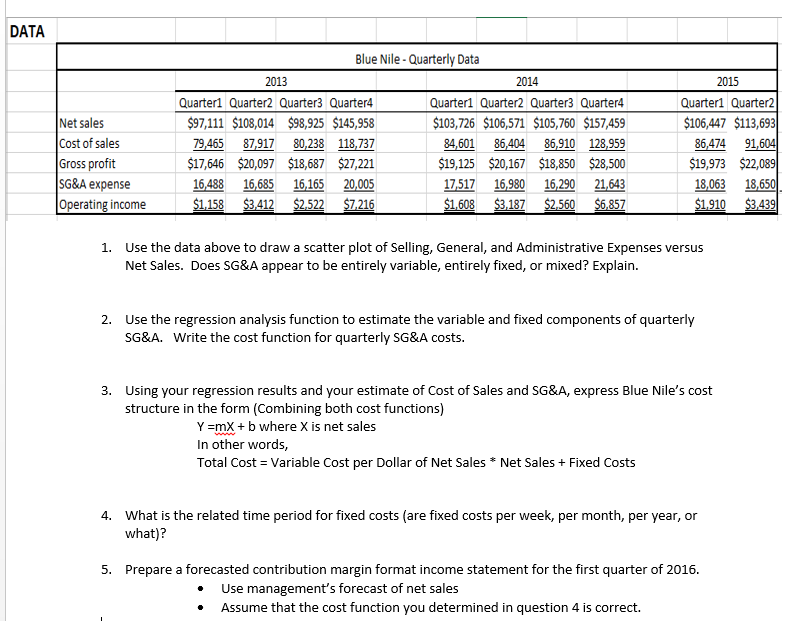
DATA Blue Nile- Quarterly Data 2014 Quarterl Quarter2 Quarter3 Quarter4 103,726 $106,571 $105,760 $157,459 84,601 86404 86,910 128,959 $19,125 $20,167 $18,850 $28,500 17517 16980 16,290 21,643 $1,608$3,187$2,560 $6,857 2013 2015 Quarterl Quarter2 106,447 $113,693 86,474 91 Net sales Cost of sales Gross profit SG&A expense Operating income Quarter Quarter2 Quarter3 Quarter4 $97,111 $108,014 $98,925 $145,958 79,465 87917 80,238 118,737 $17,646 $20,097 $18,687 $27,221 6,488 16,685 16,165 20,005 $1,158$3.412$2,522 $7.216 $19,973 18,063 18 $1,910 $3,439 1. Use the data above to draw a scatter plot of Selling, General, and Administrative Expenses versus Net Sales. Does SG&A appear to be entirely variable, entirely fixed, or mixed? Explain. 2. Use the regression analysis function to estimate the variable and fixed components of quarterly SG&A. Write the cost function for quarterly SG&A costs. 3. Using your regression results and your estimate of Cost of Sales and SG&A, express Blue Nile's cost structure in the form (Combining both cost functions) Y =mx + b where X is net sales In other words, Total Cost Variable Cost per Dollar of Net Sales Net SalesFixed Costs What is the related time period for fixed costs (are fixed costs per week, per month, per year, or what)? 4. 5. Prepare a forecasted contribution margin format income statement for the first quarter of 2016. Use management's forecast of net sales Assume that the cost function you determined in question 4 is correct. . DATA Blue Nile- Quarterly Data 2014 Quarterl Quarter2 Quarter3 Quarter4 103,726 $106,571 $105,760 $157,459 84,601 86404 86,910 128,959 $19,125 $20,167 $18,850 $28,500 17517 16980 16,290 21,643 $1,608$3,187$2,560 $6,857 2013 2015 Quarterl Quarter2 106,447 $113,693 86,474 91 Net sales Cost of sales Gross profit SG&A expense Operating income Quarter Quarter2 Quarter3 Quarter4 $97,111 $108,014 $98,925 $145,958 79,465 87917 80,238 118,737 $17,646 $20,097 $18,687 $27,221 6,488 16,685 16,165 20,005 $1,158$3.412$2,522 $7.216 $19,973 18,063 18 $1,910 $3,439 1. Use the data above to draw a scatter plot of Selling, General, and Administrative Expenses versus Net Sales. Does SG&A appear to be entirely variable, entirely fixed, or mixed? Explain. 2. Use the regression analysis function to estimate the variable and fixed components of quarterly SG&A. Write the cost function for quarterly SG&A costs. 3. Using your regression results and your estimate of Cost of Sales and SG&A, express Blue Nile's cost structure in the form (Combining both cost functions) Y =mx + b where X is net sales In other words, Total Cost Variable Cost per Dollar of Net Sales Net SalesFixed Costs What is the related time period for fixed costs (are fixed costs per week, per month, per year, or what)? 4. 5. Prepare a forecasted contribution margin format income statement for the first quarter of 2016. Use management's forecast of net sales Assume that the cost function you determined in question 4 is correct