

Answered step by step
Verified Expert Solution
Question
1 Approved Answer
Use table NPV in the table to determine optimistic and pessimistic NPV projected values Blooper's analysts have come up with the following revised estimates for
Use table NPV in the table to determine optimistic and pessimistic NPV projected values
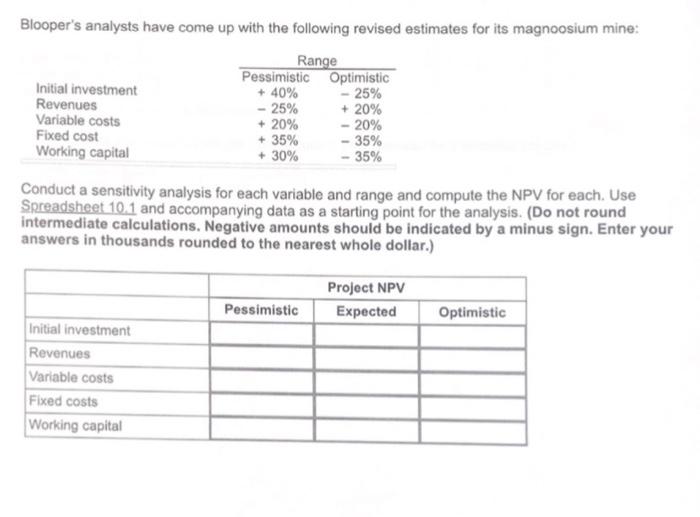
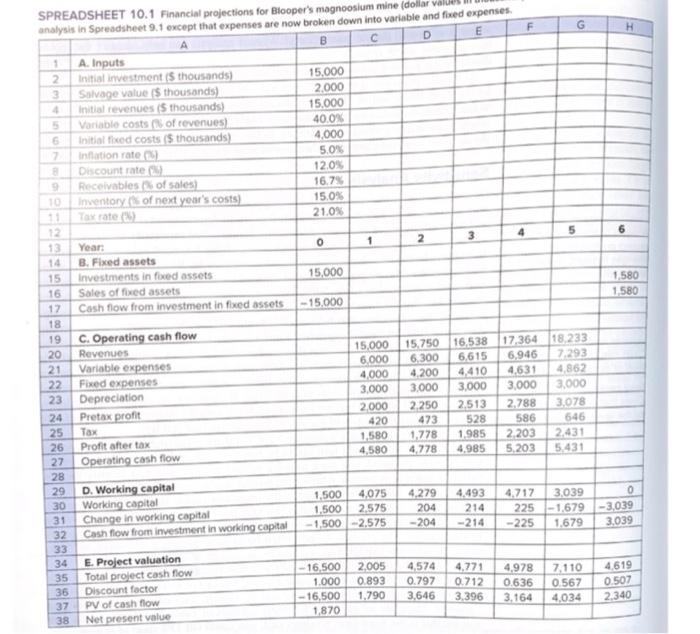
Blooper's analysts have come up with the following revised estimates for its magnoosium mine: Initial investment Revenues Variable costs Fixed cost Working capital Range Pessimistic Optimistic + 40% - 25% - 25% + 20% + 20% - 20% + 35% - 35% + 30% - 35% Conduct a sensitivity analysis for each variable and range and compute the NPV for each. Use Spreadsheet 10.1 and accompanying data as a starting point for the analysis. (Do not round intermediate calculations. Negative amounts should be indicated by a minus sign. Enter your answers in thousands rounded to the nearest whole dollar.) Project NPV Pessimistic Expected Optimistic Initial investment Revenues Variable costs Fixed costs Working capital SPREADSHEET 10.1 Financial projections for Blooper's magnoosium mine (dollar values analysis in Spreadsheet 9.1 except that expenses are now broken down into variable and fixed expenses F G H D E A B 1 2 4 5 6 A. Inputs Initial investment is thousands) Salvage value $ thousands) Initial revenues is thousands) Variable costs of revenues) Initial fixed costs $thousands) Inflation rate Discount rate Receivables of sales) Inventory of next year's costs) Tax rate 15,000 2.000 15.000 400% 4,000 5.0% 12.0% 16.7% 15.0% 21.09 7 10 11 4 5 6 3 0 1 2 13 Year: 14 B. Fixed assets Investments in fixed assets 15,000 15 16 1.580 1580 Sales of fixed assets 17 - 15,000 Cash flow from investment in fixed assets 18 19 20 21 22 23 15,000 6.000 4000 3.000 17,36418.233 6,946 72293 4,631 4,862 3,000 3,000 C. Operating cash flow Revenues Variable expenses Fixed expenses Depreciation Pretax profit Tax Profit after tax Operating cash flow 15.750 16.538 6.300 6,615 4.200 4,410 3.000 3.000 2.250 2.513 473 528 1,778 1.985 4,778 4.985 2.000 420 1,580 4,580 24 25 26 27 28 29 2.788 586 2.203 5.203 3.078 646 2.431 5.431 30 D. Working capital Working capital Change in working capital Cash flow from investment in working capital 1,500 4,075 1,500 2.575 - 1500-2.575 4.279 204 - 204 4,493 214 -214 4,717 225 -225 3,039 0 -1.679 -3,039 1.679 3.039 31 32 . 33 34 35 E. Project valuation Total project cash flow Discount factor PV of cash flow Net present value - 16,500 1.000 - 16,500 1,870 2.005 0.893 1.790 4,574 0.797 3,646 4,771 0.712 3.396 4,978 0.636 3.164 2A110 0.567 4,034 36 4.619 0.507 2.340 37 38 Step by Step Solution
There are 3 Steps involved in it
Step: 1

Get Instant Access to Expert-Tailored Solutions
See step-by-step solutions with expert insights and AI powered tools for academic success
Step: 2

Step: 3
Ace Your Homework with AI
Get the answers you need in no time with our AI-driven, step-by-step assistance
Get Started
The Structural Foundations Of Monetary Policy
Authors: Michael D. Bordo, John H. Cochrane, Amit Seru
1st Edition
0817921346, 978-0817921347