Answered step by step
Verified Expert Solution
Question
1 Approved Answer
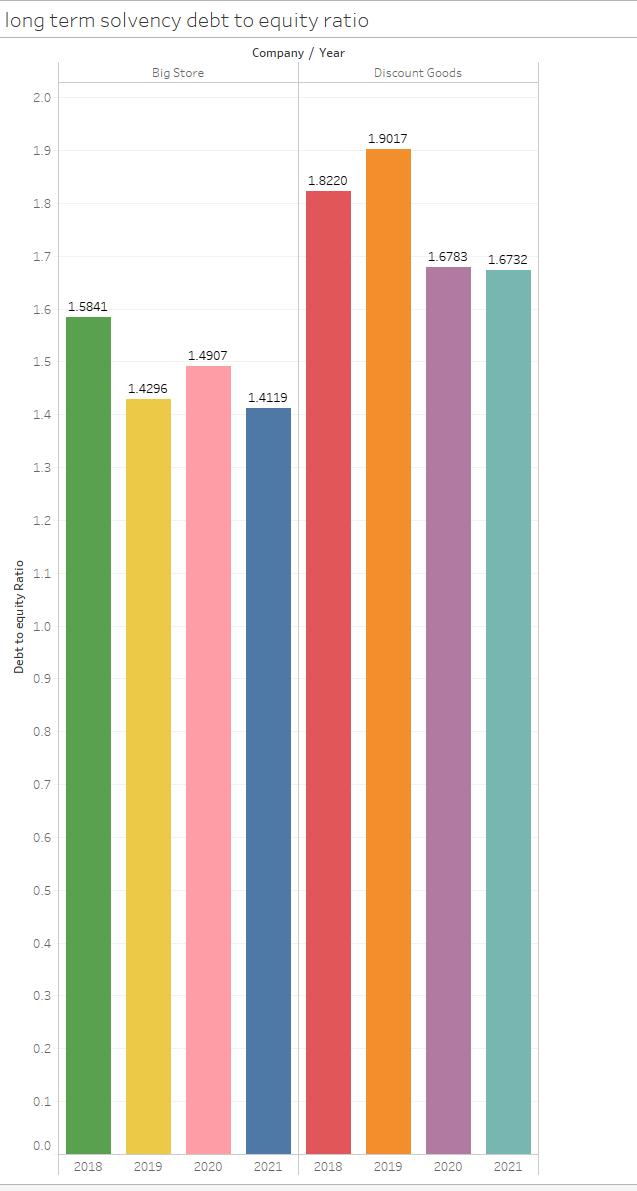
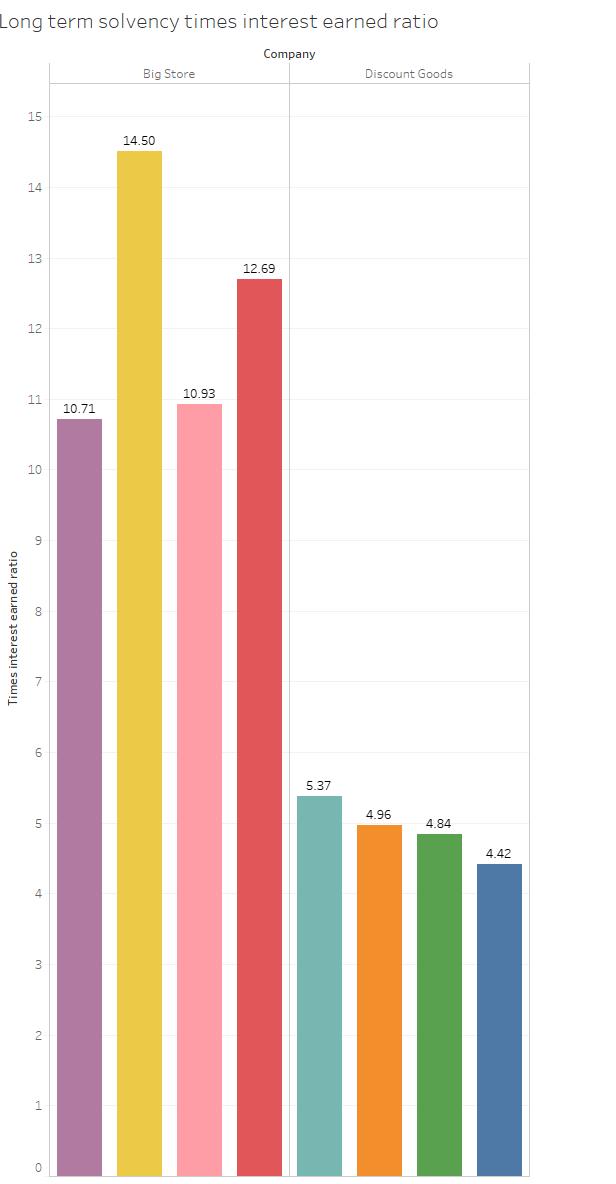
Use Tableau to calculate and display the trends for the debt to equity and times interest earned ratios for each of the two companies


Use Tableau to calculate and display the trends for the debt to equity and times interest earned ratios for each of the two companies in the period 2018-2021. The average debt to equity ratio and times interest earned ratio for companies in the General Retailers industry sector in a comparable time period are 1.92 and 10.6, respectively. Based upon what you find, answer the following questions: 1. Other things being equal, do both companies appear to have the ability to meet their obligations as measured by the debt to equity ratio? 2. Based solely on the times interest earned ratios, do you reach the same conclusion as in Requirement 1? 3. Is the margin of safety provided to creditors by Discount Goods improving or declining in recent years as measured by the average times interest earned ratio? long term solvency debt to equity ratio Company / Year Big Store Discount Goods 2.0 1.9017 1.9 1.8220 1.8 1.7 1.6783 1.6732 1.6 1.5841 1.4907 1.5 1.4296 1.4119 1.4 1.3 1.2 1.1 1.0 0.9 0.8 0.7 0.6 0.5 0.4 0.3 0.2 0.1 0.0 2018 2019 2020 2021 2018 2019 2020 2021 Debt to equity Ratio Long term solvency times interest earned ratio Company Big Store Discount Goods 15 14.50 14 13 12.69 12 10.93 11 10.71 10 5.37 4.96 4.84 4.42 4 3 Times interest earned ratio
Step by Step Solution
★★★★★
3.45 Rating (164 Votes )
There are 3 Steps involved in it
Step: 1
As there is two companies data is given relevant to debt to equity ratio and interest earned ratio and also given the industry average ratio of both e...
Get Instant Access to Expert-Tailored Solutions
See step-by-step solutions with expert insights and AI powered tools for academic success
Step: 2

Step: 3

Ace Your Homework with AI
Get the answers you need in no time with our AI-driven, step-by-step assistance
Get Started


