Question
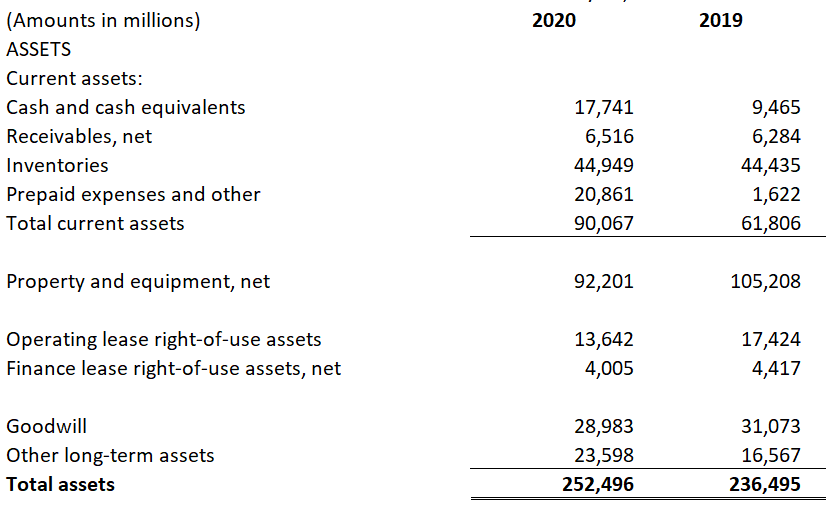
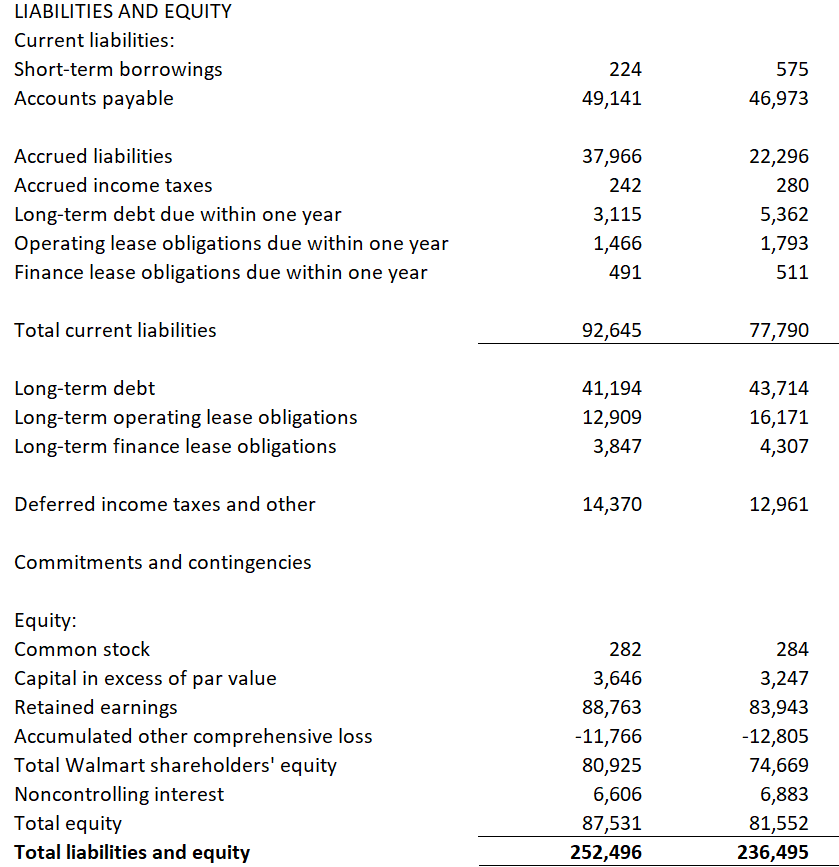
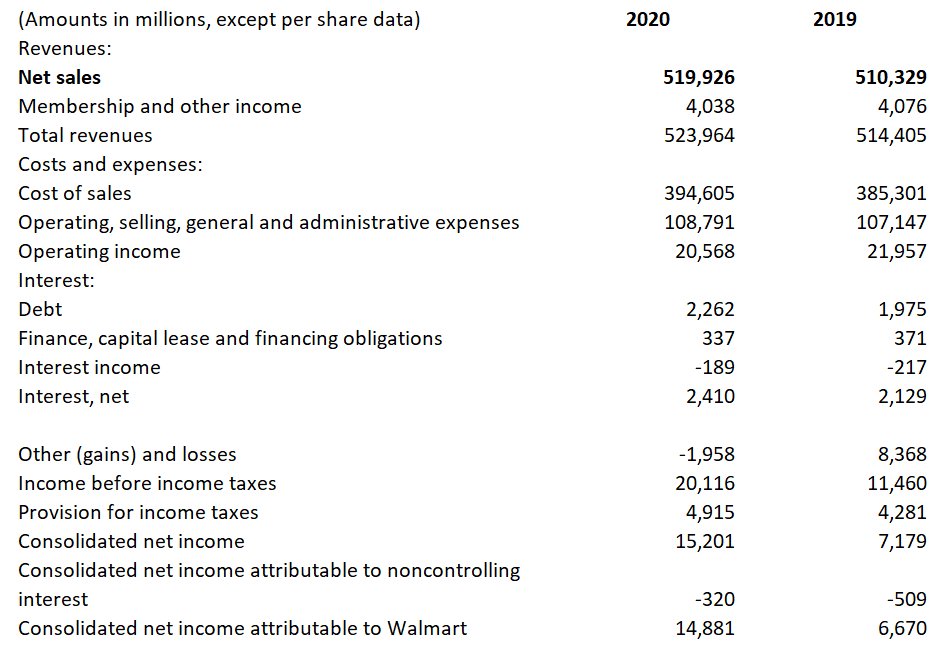
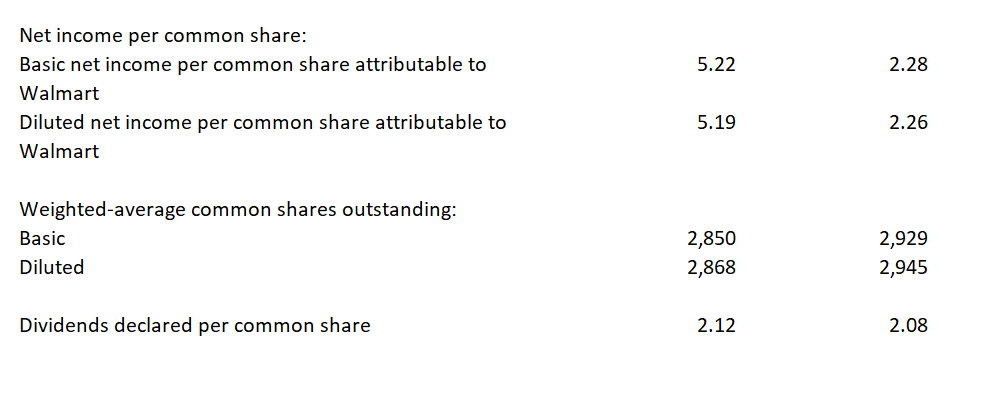
Use the above balanced sheet and income statement: -Calculate profitability ratios (Gross Profit Margin, Operating Profit Margin, Net Profit Margin, ROA, ROE) for all years


Use the above balanced sheet and income statement:
-Calculate profitability ratios (Gross Profit Margin, Operating Profit Margin, Net Profit Margin, ROA, ROE) for all years presented. Assess the company based on its profitability. Comment on any significant year-to-year changes. Evaluate the company based on its profitability compared to industry median values.
- Calculate short-term solvency ratios (Current Ratio, Quick Ratio, Average Collection Period, Days Inventory Held, Days Payable Outstanding) for all years presented. Assess the company based on its short-term solvency. Comment on any significant year-to-year changes. Evaluate the company based on its short-term solvency compared to industry median values.
2020 2019 (Amounts in millions) ASSETS Current assets: Cash and cash equivalents Receivables, net Inventories 17,741 6,516 44,949 20,861 90,067 9,465 6,284 44,435 1,622 61,806 Prepaid expenses and other Total current assets Property and equipment, net 92,201 105,208 Operating lease right-of-use assets Finance lease right-of-use assets, net 13,642 4,005 17,424 4,417 Goodwill Other long-term assets Total assets 28,983 23,598 252,496 31,073 16,567 236,495 LIABILITIES AND EQUITY Current liabilities: 224 575 Short-term borrowings Accounts payable 49,141 46,973 Accrued liabilities 37,966 22,296 Accrued income taxes 242 280 Long-term debt due within one year Operating lease obligations due within one year Finance lease obligations due within one year 3,115 1,466 5,362 1,793 491 511 Total current liabilities 92,645 77,790 Long-term debt Long-term operating lease obligations Long-term finance lease obligations 41,194 12,909 3,847 43,714 16,171 4,307 Deferred income taxes and other 14,370 12,961 Commitments and contingencies Equity: Common stock 282 284 Capital in excess of par value Retained earnings Accumulated other comprehensive loss Total Walmart shareholders' equity Noncontrolling interest Total equity Total liabilities and equity 3,646 88,763 -11,766 80,925 6,606 87,531 252,496 3,247 83,943 -12,805 74,669 6,883 81,552 236,495 (Amounts in millions, except per share data) 2020 2019 Revenues: Net sales 519,926 510,329 Membership and other income Total revenues 4,038 523,964 4,076 514,405 Costs and expenses: Cost of sales Operating, selling, general and administrative expenses Operating income 394,605 108,791 20,568 385,301 107,147 21,957 Interest: Debt 2,262 1,975 Finance, capital lease and financing obligations 337 371 Interest income -189 -217 Interest, net 2,410 2,129 Other (gains) and losses Income before income taxes -1,958 20,116 4,915 15,201 8,368 11,460 4,281 7,179 Provision for income taxes Consolidated net income Consolidated net income attributable to noncontrolling interest -320 -509 Consolidated net income attributable to Walmart 14,881 6,670 Net income per common share: Basic net income per common share attributable to Walmart 5.22 2.28 5.19 2.26 Diluted net income per common share attributable to Walmart Weighted average common shares outstanding: Basic 2,850 2,868 2,929 2,945 Diluted Dividends declared per common share 2.12 2.08 2020 2019 (Amounts in millions) ASSETS Current assets: Cash and cash equivalents Receivables, net Inventories 17,741 6,516 44,949 20,861 90,067 9,465 6,284 44,435 1,622 61,806 Prepaid expenses and other Total current assets Property and equipment, net 92,201 105,208 Operating lease right-of-use assets Finance lease right-of-use assets, net 13,642 4,005 17,424 4,417 Goodwill Other long-term assets Total assets 28,983 23,598 252,496 31,073 16,567 236,495 LIABILITIES AND EQUITY Current liabilities: 224 575 Short-term borrowings Accounts payable 49,141 46,973 Accrued liabilities 37,966 22,296 Accrued income taxes 242 280 Long-term debt due within one year Operating lease obligations due within one year Finance lease obligations due within one year 3,115 1,466 5,362 1,793 491 511 Total current liabilities 92,645 77,790 Long-term debt Long-term operating lease obligations Long-term finance lease obligations 41,194 12,909 3,847 43,714 16,171 4,307 Deferred income taxes and other 14,370 12,961 Commitments and contingencies Equity: Common stock 282 284 Capital in excess of par value Retained earnings Accumulated other comprehensive loss Total Walmart shareholders' equity Noncontrolling interest Total equity Total liabilities and equity 3,646 88,763 -11,766 80,925 6,606 87,531 252,496 3,247 83,943 -12,805 74,669 6,883 81,552 236,495 (Amounts in millions, except per share data) 2020 2019 Revenues: Net sales 519,926 510,329 Membership and other income Total revenues 4,038 523,964 4,076 514,405 Costs and expenses: Cost of sales Operating, selling, general and administrative expenses Operating income 394,605 108,791 20,568 385,301 107,147 21,957 Interest: Debt 2,262 1,975 Finance, capital lease and financing obligations 337 371 Interest income -189 -217 Interest, net 2,410 2,129 Other (gains) and losses Income before income taxes -1,958 20,116 4,915 15,201 8,368 11,460 4,281 7,179 Provision for income taxes Consolidated net income Consolidated net income attributable to noncontrolling interest -320 -509 Consolidated net income attributable to Walmart 14,881 6,670 Net income per common share: Basic net income per common share attributable to Walmart 5.22 2.28 5.19 2.26 Diluted net income per common share attributable to Walmart Weighted average common shares outstanding: Basic 2,850 2,868 2,929 2,945 Diluted Dividends declared per common share 2.12 2.08Step by Step Solution
There are 3 Steps involved in it
Step: 1

Get Instant Access to Expert-Tailored Solutions
See step-by-step solutions with expert insights and AI powered tools for academic success
Step: 2

Step: 3

Ace Your Homework with AI
Get the answers you need in no time with our AI-driven, step-by-step assistance
Get Started


