

Answered step by step
Verified Expert Solution
Question
1 Approved Answer
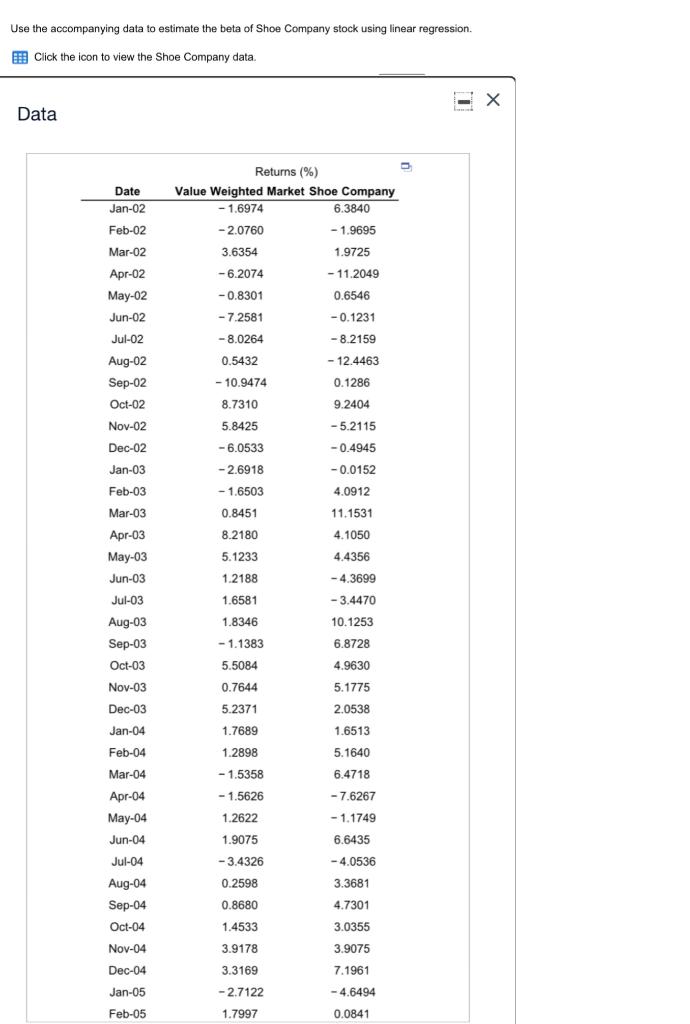
Use the accompanying data to estimate the beta of Shoe Company stock using linear regression. Click the icon to view the Shoe Company data. X
Step by Step Solution
There are 3 Steps involved in it
Step: 1

Get Instant Access to Expert-Tailored Solutions
See step-by-step solutions with expert insights and AI powered tools for academic success
Step: 2

Step: 3
Ace Your Homework with AI
Get the answers you need in no time with our AI-driven, step-by-step assistance
Get Started
Quantitative Analysis For Management
Authors: Barry Render, Ralph M. Stair, Michael E. Hanna, Trevor S. Hale
14th Edition
0137943601, 9780137943609