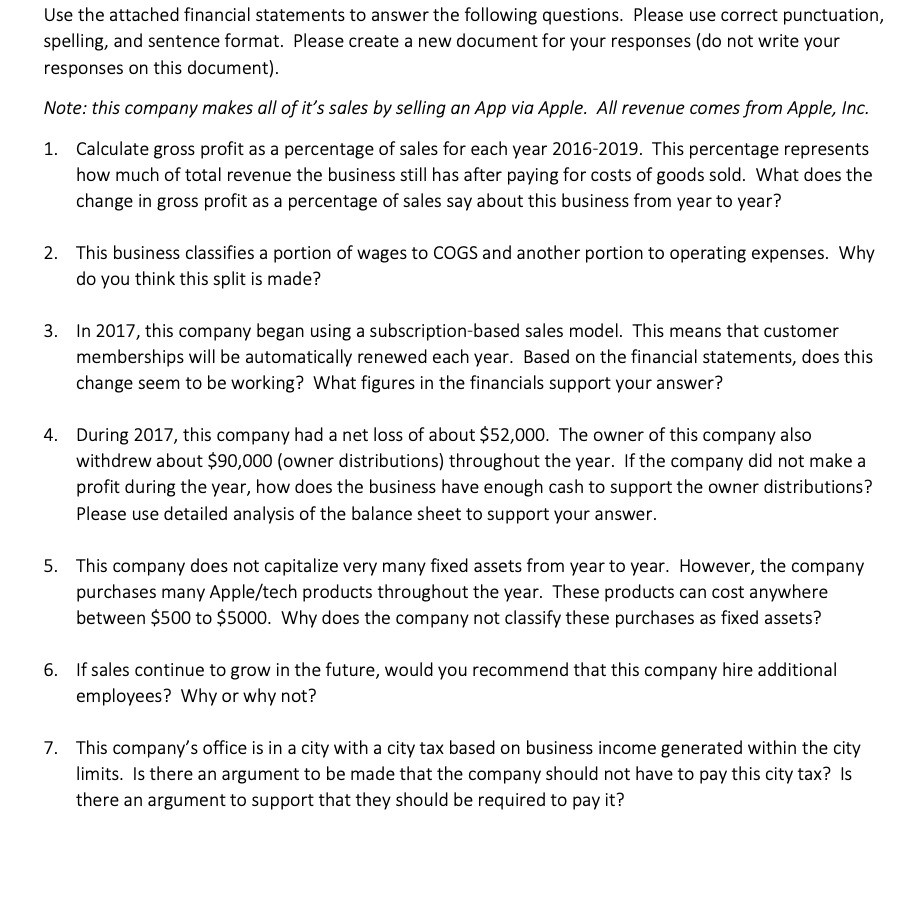
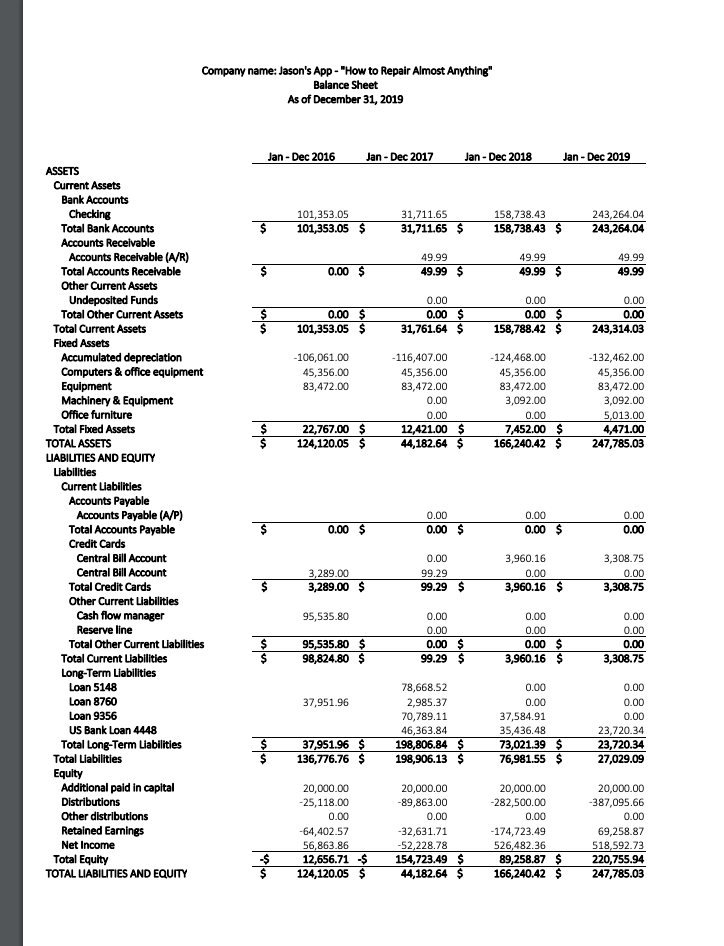
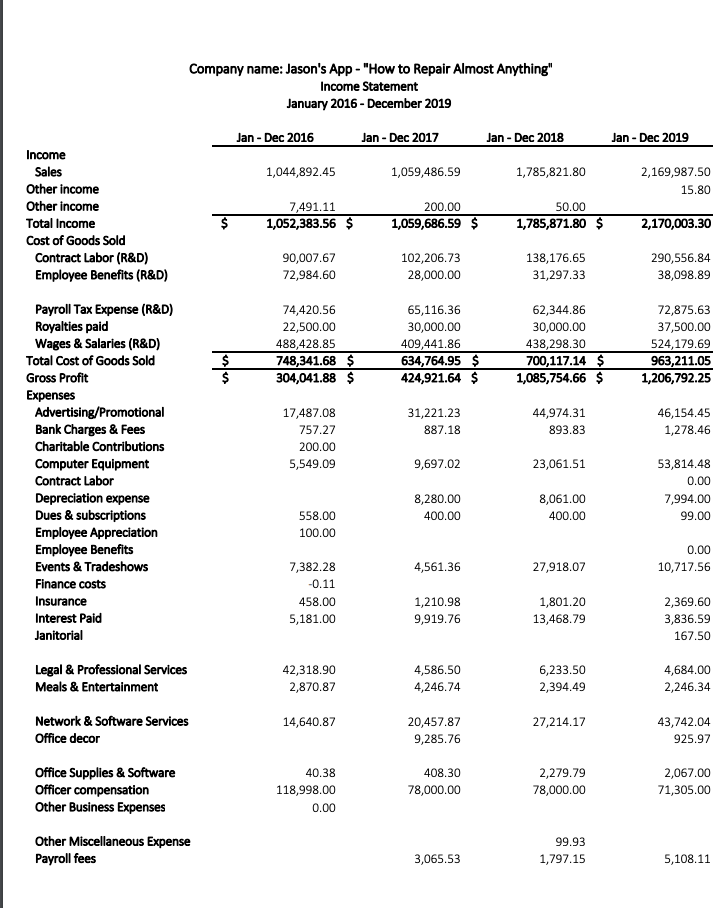
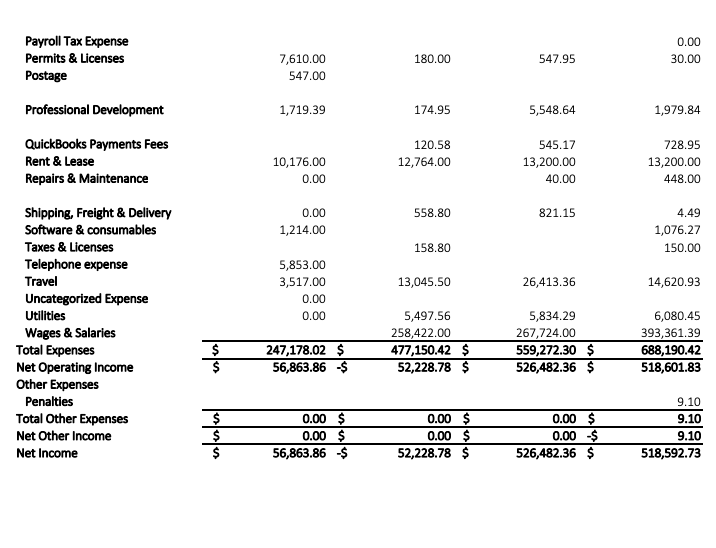
Use the attached financial statements to answer the following questions. Please use correct punctuation, spelling, and sentence format. Please create a new document for your responses (do not write your responses on this document). Note: this company makes all of it's sales by selling an App via Apple. All revenue comes from Apple, Inc. 1. Calculate gross profit as a percentage of sales for each year 2016-2019. This percentage represents how much of total revenue the business still has after paying for costs of goods sold. What does the change in gross profit as a percentage of sales say about this business from year to year? 2. This business classifies a portion of wages to COGS and another portion to operating expenses. Why do you think this split is made? 3. In 2017, this company began using a subscription-based sales model. This means that customer memberships will be automatically renewed each year. Based on the financial statements, does this change seem to be working? What figures in the financials support your answer? 4. During 2017, this company had a net loss of about $52,000. The owner of this company also withdrew about $90,000 (owner distributions) throughout the year. If the company did not make a profit during the year, how does the business have enough cash to support the owner distributions? Please use detailed analysis of the balance sheet to support your answer. 5. This company does not capitalize very many fixed assets from year to year. However, the company purchases many Apple/tech products throughout the year. These products can cost anywhere between $500 to $5000. Why does the company not classify these purchases as fixed assets? 6. If sales continue to grow in the future, would you recommend that this company hire additional employees? Why or why not? 7. This company's office is in a city with a city tax based on business income generated within the city limits. Is there an argument to be made that the company should not have to pay this city tax? Is there an argument to support that they should be required to pay it? Company name: Jason's App - "How to Repair Almost Anything" Balance Sheet As of December 31, 2019 Jan-Dec 2016 Jan-Dec 2017 Jan-Dec 2018 Jan-Dec 2019 $ 101,353.05 101,353.05 $ 31,711.65 31,711.65 158,738.43 158,738.43 $ 243,264.04 243,264.04 49.99 49.99 $ 49.99 49.99 $ 49.99 49.99 0.00 $ 0.00 $ 101,353.05 $ 0.00 0.00 $ 31,761.64 $ 0.00 0.00 $ 158,788.42 $ 0.00 0.00 243,314.03 -106,061.00 45,356.00 83,472.00 -116,407.00 45,356.00 83,472.00 0.00 0.00 12,421.00 $ 44,182.64 $ -124,468.00 45,356.00 83,472.00 3,092.00 0.00 7,452.00 $ 166,240.42 $ -132,462.00 45,356.00 83,472.00 3,092.00 5,013.00 4,471.00 247,785.03 $ $ 22,767.00 $ 124, 120.05 $ ASSETS Current Assets Bank Accounts Checking Total Bank Accounts Accounts Receivable Accounts Receivable (A/R) Total Accounts Receivable Other Current Assets Undeposited Funds Total Other Current Assets Total Current Assets Fixed Assets Accumulated depreciation Computers & office equipment Equipment Machinery & Equipment Office furniture Total Fired Assets TOTAL ASSETS LIABILITIES AND EQUITY Liabilities Current Liabilities Accounts Payable Accounts Payable (A/P) Total Accounts Payable Credit Cards Central Bill Account Central Bill Account Total Credit Cards Other Current Liabilities Cash flow manager Reserve line Total Other Current Liabilities Total Current Liabilities Long-Term Liabilities Loan 5148 Loan 8760 Loan 9356 US Bank Loan 4448 Total Long-Term Liabilities Total Liabilities Equity Additional paid in capital Distributions Other distributions Retained Earnings Net Income Total Equity TOTAL LIABILITIES AND EQUITY 0.00 $ 0.00 0.00 $ 0.00 0.00 $ 0.00 0.00 0.00 99.29 99.29 $ 3,289.00 3,289.00 $ 3,960.16 0.00 3,960.16 $ 3,308.75 0.00 3,308.75 $ 95,535.80 $ $ 0.00 0.00 0.00 $ 99.29 $ 0.00 0.00 0.00 $ 3,960.16 $ 0.00 0.00 0.00 3,308.75 95,535.80 $ 98,824.80 $ 37,951.96 78,668.52 2,985.37 70,789.11 46,363.84 198,806.84 $ 198,906.13 $ 0.00 0.00 37,584.91 35,436.48 73,021.39 $ 76,981.55 $ 0.00 0.00 0.00 23,720.34 23,720.34 27,029.09 $ 37,951.96 $ 136,776.76 $ 20,000.00 -25, 118.00 0.00 -64,402.57 56,863.86 12,656.71 $ 124, 120.05 $ 20,000.00 -89,863.00 0.00 -32,631.71 -52,228.78 154,723.49 $ 44,182.64 $ 20,000.00 -282,500.00 0.00 -174,723.49 526,482.36 89,258.87 $ 166,240.42 $ 20,000.00 -387,095.66 0.00 69,258.87 518,592.73 220,755.94 247,785.03 $ Company name: Jason's App - "How to Repair Almost Anything" Income Statement January 2016 - December 2019 Jan-Dec 2016 Jan - Dec 2017 Jan - Dec 2018 Jan-Dec 2019 1,044,892.45 1,059,486.59 1,785,821.80 2,169,987.50 15.80 Income Sales Other income Other income Total Income Cost of Goods Sold Contract Labor (R&D) Employee Benefits (R&D) 7,491.11 1,052,383.56 $ $ 200.00 1,059,686.59 $ 50.00 1,785,871.80 $ 2,170,003.30 90,007.67 72,984.60 102,206.73 28,000.00 138,176.65 31,297.33 290,556.84 38,098.89 74,420.56 22,500.00 488,428.85 748,341.68 $ 304,041.88 $ 65,116.36 30,000.00 409,441.86 634,764.95 $ 424,921.64 $ 62,344.86 30,000.00 438,298.30 700, 117.14 $ 1,085,754.66 $ 72,875.63 37,500.00 524,179.69 963,211.05 1,206,792.25 $ 31,221.23 887.18 44,974.31 893.83 46,154.45 1,278.46 17,487.08 757.27 200.00 5,549.09 9,697.02 23,061.51 Payroll Tax Expense (R&D) Royalties paid Wages & Salaries (R&D) Total Cost of Goods Sold Gross Profit Expenses Advertising/Promotional Bank Charges & Fees Charitable Contributions Computer Equipment Contract Labor Depreciation expense Dues & subscriptions Employee Appreciation Employee Benefits Events & Tradeshows Finance costs Insurance Interest Paid Janitorial 53,814.48 0.00 7,994.00 99.00 8,280.00 400.00 8,061.00 400.00 558.00 100.00 4,561.36 27,918.07 0.00 10,717.56 7,382.28 -0.11 458.00 5,181.00 1,210.98 9,919.76 1,801.20 13,468.79 2,369.60 3,836.59 167.50 Legal & Professional Services Meals & Entertainment 42,318.90 2,870.87 4,586.50 4,246.74 6,233.50 2,394.49 4,684.00 2,246.34 Network & Software Services Office decor 14,640.87 27,214.17 20,457.87 9,285.76 43,742.04 925.97 Office Supplies & Software Officer compensation Other Business Expenses 40.38 118,998.00 0.00 408.30 78,000.00 2,279.79 78,000.00 2,067.00 71,305.00 Other Miscellaneous Expense Payroll fees 99.93 1,797.15 3,065.53 5,108.11 Payroll Tax Expense Permits & Licenses Postage 0.00 30.00 180.00 547.95 7,610.00 547.00 Professional Development 1,719.39 174.95 5,548.64 1,979.84 QuickBooks Payments Fees Rent & Lease Repairs & Maintenance 120.58 12,764.00 10,176.00 0.00 545.17 13,200.00 40.00 728.95 13,200.00 448.00 558.80 821.15 0.00 1,214.00 4.49 1,076.27 150.00 158.80 13,045.50 26,413.36 14,620.93 5,853.00 3,517.00 0.00 0.00 Shipping, Freight & Delivery Software & consumables Taxes & Licenses Telephone expense Travel Uncategorized Expense Utilities Wages & Salaries Total Expenses Net Operating Income Other Expenses Penalties Total Other Expenses Net Other Income Net Income 5,497.56 258,422.00 477,150.42 $ 52,228.78 $ 247,178.02 $ 56,863.86 -$ 5,834.29 267,724.00 559,272.30 $ 526,482.36 $ 6,080.45 393,361.39 688,190.42 518,601.83 $ $ $ 0.00 $ 0.00 $ 56,863.86 -$ 0.00 $ 0.00 $ 52,228.78 $ 0.00 $ 0.00 $ 526,482.36 $ 9.10 9.10 9.10 518,592.73 Use the attached financial statements to answer the following questions. Please use correct punctuation, spelling, and sentence format. Please create a new document for your responses (do not write your responses on this document). Note: this company makes all of it's sales by selling an App via Apple. All revenue comes from Apple, Inc. 1. Calculate gross profit as a percentage of sales for each year 2016-2019. This percentage represents how much of total revenue the business still has after paying for costs of goods sold. What does the change in gross profit as a percentage of sales say about this business from year to year? 2. This business classifies a portion of wages to COGS and another portion to operating expenses. Why do you think this split is made? 3. In 2017, this company began using a subscription-based sales model. This means that customer memberships will be automatically renewed each year. Based on the financial statements, does this change seem to be working? What figures in the financials support your answer? 4. During 2017, this company had a net loss of about $52,000. The owner of this company also withdrew about $90,000 (owner distributions) throughout the year. If the company did not make a profit during the year, how does the business have enough cash to support the owner distributions? Please use detailed analysis of the balance sheet to support your answer. 5. This company does not capitalize very many fixed assets from year to year. However, the company purchases many Apple/tech products throughout the year. These products can cost anywhere between $500 to $5000. Why does the company not classify these purchases as fixed assets? 6. If sales continue to grow in the future, would you recommend that this company hire additional employees? Why or why not? 7. This company's office is in a city with a city tax based on business income generated within the city limits. Is there an argument to be made that the company should not have to pay this city tax? Is there an argument to support that they should be required to pay it? Company name: Jason's App - "How to Repair Almost Anything" Balance Sheet As of December 31, 2019 Jan-Dec 2016 Jan-Dec 2017 Jan-Dec 2018 Jan-Dec 2019 $ 101,353.05 101,353.05 $ 31,711.65 31,711.65 158,738.43 158,738.43 $ 243,264.04 243,264.04 49.99 49.99 $ 49.99 49.99 $ 49.99 49.99 0.00 $ 0.00 $ 101,353.05 $ 0.00 0.00 $ 31,761.64 $ 0.00 0.00 $ 158,788.42 $ 0.00 0.00 243,314.03 -106,061.00 45,356.00 83,472.00 -116,407.00 45,356.00 83,472.00 0.00 0.00 12,421.00 $ 44,182.64 $ -124,468.00 45,356.00 83,472.00 3,092.00 0.00 7,452.00 $ 166,240.42 $ -132,462.00 45,356.00 83,472.00 3,092.00 5,013.00 4,471.00 247,785.03 $ $ 22,767.00 $ 124, 120.05 $ ASSETS Current Assets Bank Accounts Checking Total Bank Accounts Accounts Receivable Accounts Receivable (A/R) Total Accounts Receivable Other Current Assets Undeposited Funds Total Other Current Assets Total Current Assets Fixed Assets Accumulated depreciation Computers & office equipment Equipment Machinery & Equipment Office furniture Total Fired Assets TOTAL ASSETS LIABILITIES AND EQUITY Liabilities Current Liabilities Accounts Payable Accounts Payable (A/P) Total Accounts Payable Credit Cards Central Bill Account Central Bill Account Total Credit Cards Other Current Liabilities Cash flow manager Reserve line Total Other Current Liabilities Total Current Liabilities Long-Term Liabilities Loan 5148 Loan 8760 Loan 9356 US Bank Loan 4448 Total Long-Term Liabilities Total Liabilities Equity Additional paid in capital Distributions Other distributions Retained Earnings Net Income Total Equity TOTAL LIABILITIES AND EQUITY 0.00 $ 0.00 0.00 $ 0.00 0.00 $ 0.00 0.00 0.00 99.29 99.29 $ 3,289.00 3,289.00 $ 3,960.16 0.00 3,960.16 $ 3,308.75 0.00 3,308.75 $ 95,535.80 $ $ 0.00 0.00 0.00 $ 99.29 $ 0.00 0.00 0.00 $ 3,960.16 $ 0.00 0.00 0.00 3,308.75 95,535.80 $ 98,824.80 $ 37,951.96 78,668.52 2,985.37 70,789.11 46,363.84 198,806.84 $ 198,906.13 $ 0.00 0.00 37,584.91 35,436.48 73,021.39 $ 76,981.55 $ 0.00 0.00 0.00 23,720.34 23,720.34 27,029.09 $ 37,951.96 $ 136,776.76 $ 20,000.00 -25, 118.00 0.00 -64,402.57 56,863.86 12,656.71 $ 124, 120.05 $ 20,000.00 -89,863.00 0.00 -32,631.71 -52,228.78 154,723.49 $ 44,182.64 $ 20,000.00 -282,500.00 0.00 -174,723.49 526,482.36 89,258.87 $ 166,240.42 $ 20,000.00 -387,095.66 0.00 69,258.87 518,592.73 220,755.94 247,785.03 $ Company name: Jason's App - "How to Repair Almost Anything" Income Statement January 2016 - December 2019 Jan-Dec 2016 Jan - Dec 2017 Jan - Dec 2018 Jan-Dec 2019 1,044,892.45 1,059,486.59 1,785,821.80 2,169,987.50 15.80 Income Sales Other income Other income Total Income Cost of Goods Sold Contract Labor (R&D) Employee Benefits (R&D) 7,491.11 1,052,383.56 $ $ 200.00 1,059,686.59 $ 50.00 1,785,871.80 $ 2,170,003.30 90,007.67 72,984.60 102,206.73 28,000.00 138,176.65 31,297.33 290,556.84 38,098.89 74,420.56 22,500.00 488,428.85 748,341.68 $ 304,041.88 $ 65,116.36 30,000.00 409,441.86 634,764.95 $ 424,921.64 $ 62,344.86 30,000.00 438,298.30 700, 117.14 $ 1,085,754.66 $ 72,875.63 37,500.00 524,179.69 963,211.05 1,206,792.25 $ 31,221.23 887.18 44,974.31 893.83 46,154.45 1,278.46 17,487.08 757.27 200.00 5,549.09 9,697.02 23,061.51 Payroll Tax Expense (R&D) Royalties paid Wages & Salaries (R&D) Total Cost of Goods Sold Gross Profit Expenses Advertising/Promotional Bank Charges & Fees Charitable Contributions Computer Equipment Contract Labor Depreciation expense Dues & subscriptions Employee Appreciation Employee Benefits Events & Tradeshows Finance costs Insurance Interest Paid Janitorial 53,814.48 0.00 7,994.00 99.00 8,280.00 400.00 8,061.00 400.00 558.00 100.00 4,561.36 27,918.07 0.00 10,717.56 7,382.28 -0.11 458.00 5,181.00 1,210.98 9,919.76 1,801.20 13,468.79 2,369.60 3,836.59 167.50 Legal & Professional Services Meals & Entertainment 42,318.90 2,870.87 4,586.50 4,246.74 6,233.50 2,394.49 4,684.00 2,246.34 Network & Software Services Office decor 14,640.87 27,214.17 20,457.87 9,285.76 43,742.04 925.97 Office Supplies & Software Officer compensation Other Business Expenses 40.38 118,998.00 0.00 408.30 78,000.00 2,279.79 78,000.00 2,067.00 71,305.00 Other Miscellaneous Expense Payroll fees 99.93 1,797.15 3,065.53 5,108.11 Payroll Tax Expense Permits & Licenses Postage 0.00 30.00 180.00 547.95 7,610.00 547.00 Professional Development 1,719.39 174.95 5,548.64 1,979.84 QuickBooks Payments Fees Rent & Lease Repairs & Maintenance 120.58 12,764.00 10,176.00 0.00 545.17 13,200.00 40.00 728.95 13,200.00 448.00 558.80 821.15 0.00 1,214.00 4.49 1,076.27 150.00 158.80 13,045.50 26,413.36 14,620.93 5,853.00 3,517.00 0.00 0.00 Shipping, Freight & Delivery Software & consumables Taxes & Licenses Telephone expense Travel Uncategorized Expense Utilities Wages & Salaries Total Expenses Net Operating Income Other Expenses Penalties Total Other Expenses Net Other Income Net Income 5,497.56 258,422.00 477,150.42 $ 52,228.78 $ 247,178.02 $ 56,863.86 -$ 5,834.29 267,724.00 559,272.30 $ 526,482.36 $ 6,080.45 393,361.39 688,190.42 518,601.83 $ $ $ 0.00 $ 0.00 $ 56,863.86 -$ 0.00 $ 0.00 $ 52,228.78 $ 0.00 $ 0.00 $ 526,482.36 $ 9.10 9.10 9.10 518,592.73