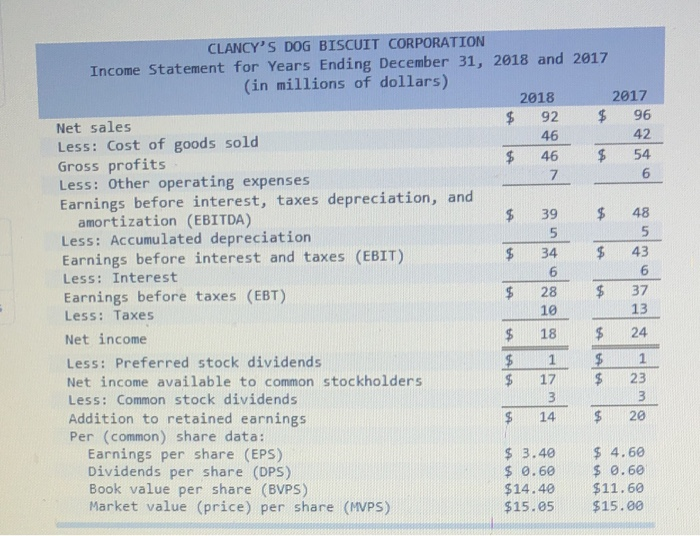
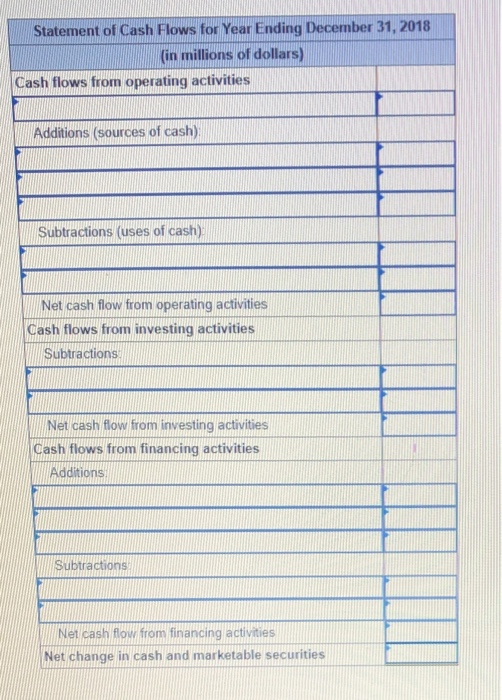
Use the balance sheet and income statement below. $ 16 11 CLANCY'S DOG BISCUIT CORPORATION Balance Sheet as of December 31, 2018 and 2017 (in millions of dollars) 2018 2017 Liabilities and Equity Current liabilities: 9 59 Accrued wages and taxes Accounts payable Notes payable Total Long-ter debt $ 74 Stockholders' equity! Preferred stock (2 million shares) Comon stock and paid-in-surplus (5 million shares) Retained earnings 77 Total $162 $135 Total liabilities and equity AC Current assets Cash and marketable securities Accounts receivable Inventory Total Fixed assetst Gross plant and equipment Less! Accumulated depreciation Net plant and equipent Other long-ters assets Total Total assets 574 $162 5135 39 CLANCY'S DOG BISCUIT CORPORATION Income Statement for Years Ending December 31, 2018 and 2017 (in millions of dollars) 2018 2017 $ 92 Net sales $ 96 Less: Cost of goods sold 46 42 $ Gross profits 46 $ 54 Less: Other operating expenses 6 Earnings before interest, taxes depreciation, and amortization (EBITDA) $ 48 Less: Accumulated depreciation Earnings before interest and taxes (EBIT) Less: Interest Earnings before taxes (EBT) $ 37 Less: Taxes Net income Less: Preferred stock dividends Net income available to common stockholders Less: Common stock dividends Addition to retained earnings Per (common) share data: Earnings per share (EPS) $ 3.40 $ 4.60 Dividends per share (DPS) $ 0.60 $ 0.60 Book value per share (BVPS) $14.40 $11.60 Market value (price) per share (MVPS) $15.05 $15.00 Statement of Cash Flows for Year Ending December 31, 2018 w in millions of dollars) Cash flows from operating activities Additions (sources of cash) wwwwwwwwwwwwww Subtractions (uses of cash) MMMMMMMMMMMMMMM wwwwwwwwwwwwwwwwwwww Net cash flow from operating activities Cash flows from investing activities Subtractions WWWWWWWWWWWWWWW WWWWWWWW Net cash flow from investing activities Cash flows from financing activities Additions Subtractions Net cash flow from financing activities Net change in cash and marketable securities