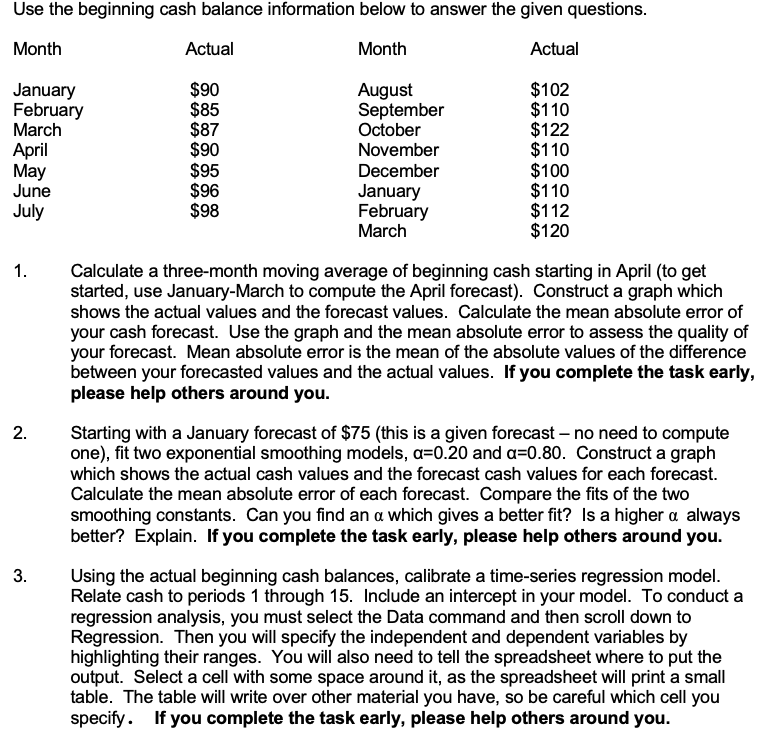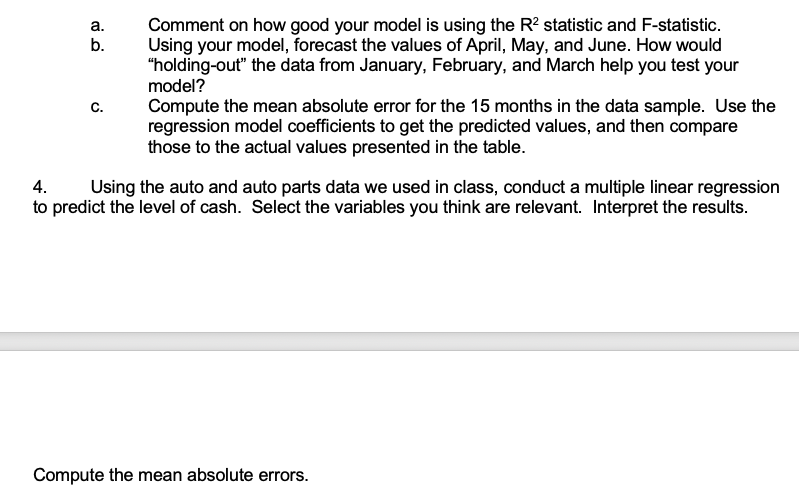

Use the beginning cash balance information below to answer the given questions. Month Actual Month Actual January February March April May June July $90 $85 $87 $90 $95 $96 $98 August September October November December January February March $102 $110 $122 $110 $100 $110 $112 $120 1. 2. Calculate a three-month moving average of beginning cash starting in April (to get started, use January-March to compute the April forecast). Construct a graph which shows the actual values and the forecast values. Calculate the mean absolute error of your cash forecast. Use the graph and the mean absolute error to assess the quality of your forecast. Mean absolute error is the mean of the absolute values of the difference between your forecasted values and the actual values. If you complete the task early, please help others around you. Starting with a January forecast of $75 (this is a given forecast - no need to compute one), fit two exponential smoothing models, a=0.20 and a=0.80. Construct a graph which shows the actual cash values and the forecast cash values for each forecast. Calculate the mean absolute error of each forecast. Compare the fits of the two smoothing constants. Can you find an a which gives a better fit? Is a higher a always better? Explain. If you complete the task early, please help others around you. Using the actual beginning cash balances, calibrate a time-series regression model. Relate cash to periods 1 through 15. Include an intercept in your model. To conduct a regression analysis, you must select the Data command and then scroll down to Regression. Then you will specify the independent and dependent variables by highlighting their ranges. You will also need to tell the spreadsheet where to put the output. Select a cell with some space around it, as the spreadsheet will print a small table. The table will write over other material you have, so be careful which cell you specify. If you complete the task early, please help others around you. 3. a. Comment on how good your model is using the R2 statistic and F-statistic. b. Using your model, forecast the values of April, May, and June. How would "holding-out" the data from January, February, and March help you test your model? c. Compute the mean absolute error for the 15 months in the data sample. Use the regression model coefficients to get the predicted values, and then compare those to the actual values presented in the table. 4. Using the auto and auto parts data we used in class, conduct a multiple linear regression to predict the level of cash. Select the variables you think are relevant. Interpret the results. Compute the mean absolute errors. Use the beginning cash balance information below to answer the given questions. Month Actual Month Actual January February March April May June July $90 $85 $87 $90 $95 $96 $98 August September October November December January February March $102 $110 $122 $110 $100 $110 $112 $120 1. 2. Calculate a three-month moving average of beginning cash starting in April (to get started, use January-March to compute the April forecast). Construct a graph which shows the actual values and the forecast values. Calculate the mean absolute error of your cash forecast. Use the graph and the mean absolute error to assess the quality of your forecast. Mean absolute error is the mean of the absolute values of the difference between your forecasted values and the actual values. If you complete the task early, please help others around you. Starting with a January forecast of $75 (this is a given forecast - no need to compute one), fit two exponential smoothing models, a=0.20 and a=0.80. Construct a graph which shows the actual cash values and the forecast cash values for each forecast. Calculate the mean absolute error of each forecast. Compare the fits of the two smoothing constants. Can you find an a which gives a better fit? Is a higher a always better? Explain. If you complete the task early, please help others around you. Using the actual beginning cash balances, calibrate a time-series regression model. Relate cash to periods 1 through 15. Include an intercept in your model. To conduct a regression analysis, you must select the Data command and then scroll down to Regression. Then you will specify the independent and dependent variables by highlighting their ranges. You will also need to tell the spreadsheet where to put the output. Select a cell with some space around it, as the spreadsheet will print a small table. The table will write over other material you have, so be careful which cell you specify. If you complete the task early, please help others around you. 3. a. Comment on how good your model is using the R2 statistic and F-statistic. b. Using your model, forecast the values of April, May, and June. How would "holding-out" the data from January, February, and March help you test your model? c. Compute the mean absolute error for the 15 months in the data sample. Use the regression model coefficients to get the predicted values, and then compare those to the actual values presented in the table. 4. Using the auto and auto parts data we used in class, conduct a multiple linear regression to predict the level of cash. Select the variables you think are relevant. Interpret the results. Compute the mean absolute errors


