

Question
Use the bivariate data provided to create a scatterplot using EXCEL or R. Use your best judgement when selecting appropriate axis labels and the axis
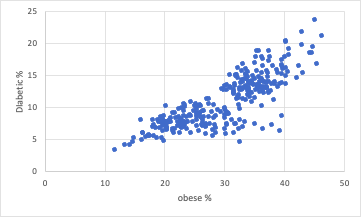
Use the bivariate data provided to create a scatterplot using EXCEL or R. Use your best judgement when selecting appropriate axis labels and the axis scale. Provide an informative figure caption for the plot.
Step by Step Solution
There are 3 Steps involved in it
Step: 1

Get Instant Access to Expert-Tailored Solutions
See step-by-step solutions with expert insights and AI powered tools for academic success
Step: 2

Step: 3
Ace Your Homework with AI
Get the answers you need in no time with our AI-driven, step-by-step assistance
Get Started
Finite Math And Applied Calculus
Authors: Stefan Waner, Steven Costenoble
6th Edition
1285415132, 9781285415130