Answered step by step
Verified Expert Solution
Question
1 Approved Answer
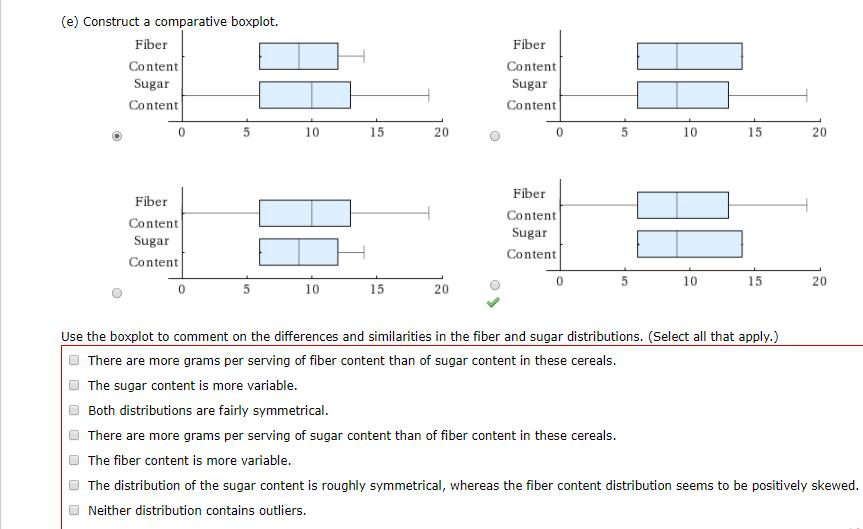
(e) Construct a comparative boxplot. Fiber Content Sugar Content 0 Fiber Content Sugar Content 5 10 10 15 15 20 20 Fiber Content Sugar

(e) Construct a comparative boxplot. Fiber Content Sugar Content 0 Fiber Content Sugar Content 5 10 10 15 15 20 20 Fiber Content Sugar Content 0 Fiber Content Sugar Content 10 10 15 15 20 20 Use the boxplot to comment on the differences and similarities in the fiber and sugar distributions. (Select all that apply.) There are more grams per serving of fiber content than of sugar content in these cereals. The sugar content is more variable. Both distributions are fairly symmetrical. There are more grams per serving of sugar content than of fiber content in these cereals. The fiber content is more variable. The distribution of the sugar content is roughly symmetrical, whereas the fiber content distribution seems to be positively skewed. Neither distribution contains outliers.
Step by Step Solution
★★★★★
3.55 Rating (190 Votes )
There are 3 Steps involved in it
Step: 1
option ...
Get Instant Access to Expert-Tailored Solutions
See step-by-step solutions with expert insights and AI powered tools for academic success
Step: 2

Step: 3

Ace Your Homework with AI
Get the answers you need in no time with our AI-driven, step-by-step assistance
Get Started


