Use the cash flows and competitive spreads shown in the table below. ($ millions) Year 0 Year 1 Year 2 Years 310 Investment 200 Production
Use the cash flows and competitive spreads shown in the table below.
| ($ millions) | ||||
| Year 0 | Year 1 | Year 2 | Years 310 | |
| Investment | 200 | |||
| Production (millions of pounds per year) | 0 | 0 | 50 | 90 |
| Spread ($ per pound) | 1.05 | 1.05 | 1.05 | 1.05 |
| Net revenues | 0 | 0 | 52.50 | 94.50 |
| Production costs | 0 | 0 | 40.00 | 40.00 |
| Transport | 0 | 0 | 0 | 0 |
| Other costs | 0 | 30 | 30 | 30 |
| Cash flow | 200 | 30 | 17.50 | 24.50 |
| NPV (at r = 8%) = 0 | ||||
Assume the dividend payout ratio each year is 100%.
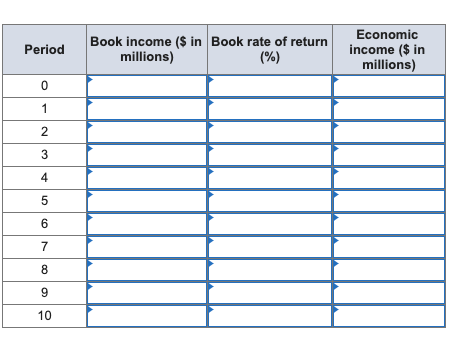
a. Calculate the yearbyyear book and economic profitability for investment in polyzone production. Assume straightline depreciation over 10 years and a cost of capital of 8%. (Negative answers should be indicated by a minus sign. Leave no cells blank be certain to enter "0" wherever required. Do not round intermediate calculations. Enter your income answers in millions rounded to 2 decimal places and enter the rate of return as a percent rounded to 2 decimal places.)
 b1. What is the economic rate of return? (Do not round intermediate calculations. Enter your answer as a percent rounded to 2 decimal places.)
| Economic rate of return | % |
b2. Now compute the steadystate book rate of return (ROI) for a mature company producing polyzone. Assume no growth and competitive spreads. (Negative answers should be indicated by a minus sign. Do not round intermediate calculations. Enter your answer as a percent rounded to 2 decimal places.)
| ROI | % |
Period Book income ($ in Book rate of return millions) (%) Economic income ($ in millions) 0 1 2 3 4 5 6 7 8 9 10
Step by Step Solution
There are 3 Steps involved in it
Step: 1

See step-by-step solutions with expert insights and AI powered tools for academic success
Step: 2

Step: 3

Ace Your Homework with AI
Get the answers you need in no time with our AI-driven, step-by-step assistance
Get Started


