

Question
Use the data in Stock.xlsx to construct histograms for monthly returns for GE and Intel. Use the data in the file Stock.xlsx to generate descriptive
Use the data in Stock.xlsx to construct histograms for monthly returns for GE and Intel.
Use the data in the file Stock.xlsx to generate descriptive statistics for Intel and GE stock.
Stock.xlsx
USE EXCEL
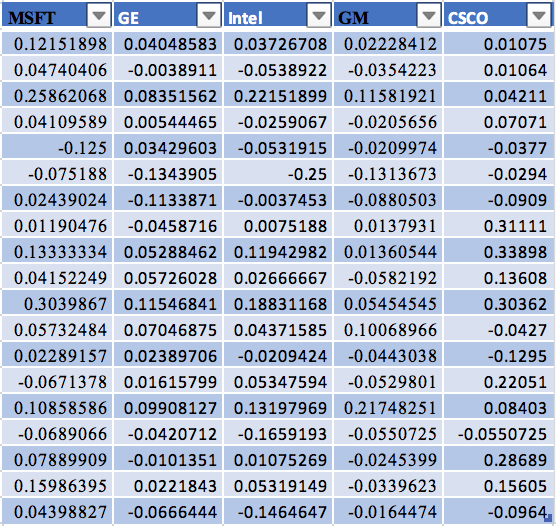
MSFT GE Intel GM CSCO 0.12151898 0.04048583 0.03726708 0.02228412 0.01075 0.04740406 -0.0038911 -0.0538922 -0.0354223 0.01064 0.04211 0.07071 0.0377 0.0294 0.0909 0.31111 0.33898 0.04152249 0.05726028 0.02666667 -0.0582192 0.13608 0.3039867 0.11546841 0.18831168 0.05454545 0.30362 0.0427 -0.1295 0.22051 0.08403 0.0689066 -0.0420712 -0.1659193 -0.0550725 -0.0550725 0.07889909 -0.0101351 0.010752690.02453990.28689 0.15605 0.25862068 0.08351562 0.22151899 0.11581921 0.04109589 0.00544465 -0.0259067-0.0205656 -0.125 0.03429603 -0.0531915 -0.0209974 0.25 0.1313673 0.02439024 -0.1133871 -0.0037453 -0.0880503 0.01190476 -0.0458716 0.0075188 0.0137931 0.13333334 0.05288462 0.11942982 0.01360544 0.075188 -0.1343905 0.05732484 0.07046875 0.04371585 0.10068966 0.02289157 0.02389706 -0.0209424 -0.0443038 0.0671378 0.01615799 0.05347594 0.0529801 0.10858586 0.09908127 0.13197969 0.21748251 0.15986395 0.0221843 0.05319149 -0.0339623 398827 0.0666444 -0.1464647 -0.0164474 -0.0964 MSFT GE Intel GM CSCO 0.12151898 0.04048583 0.03726708 0.02228412 0.01075 0.04740406 -0.0038911 -0.0538922 -0.0354223 0.01064 0.04211 0.07071 0.0377 0.0294 0.0909 0.31111 0.33898 0.04152249 0.05726028 0.02666667 -0.0582192 0.13608 0.3039867 0.11546841 0.18831168 0.05454545 0.30362 0.0427 -0.1295 0.22051 0.08403 0.0689066 -0.0420712 -0.1659193 -0.0550725 -0.0550725 0.07889909 -0.0101351 0.010752690.02453990.28689 0.15605 0.25862068 0.08351562 0.22151899 0.11581921 0.04109589 0.00544465 -0.0259067-0.0205656 -0.125 0.03429603 -0.0531915 -0.0209974 0.25 0.1313673 0.02439024 -0.1133871 -0.0037453 -0.0880503 0.01190476 -0.0458716 0.0075188 0.0137931 0.13333334 0.05288462 0.11942982 0.01360544 0.075188 -0.1343905 0.05732484 0.07046875 0.04371585 0.10068966 0.02289157 0.02389706 -0.0209424 -0.0443038 0.0671378 0.01615799 0.05347594 0.0529801 0.10858586 0.09908127 0.13197969 0.21748251 0.15986395 0.0221843 0.05319149 -0.0339623 398827 0.0666444 -0.1464647 -0.0164474 -0.0964Step by Step Solution
There are 3 Steps involved in it
Step: 1

Get Instant Access to Expert-Tailored Solutions
See step-by-step solutions with expert insights and AI powered tools for academic success
Step: 2

Step: 3
Ace Your Homework with AI
Get the answers you need in no time with our AI-driven, step-by-step assistance
Get Started
Harness The Power Of Big Data The IBM Big Data Platform
Authors: Paul Zikopoulos, David Corrigan James Giles Thomas Deutsch Krishnan Parasuraman Dirk DeRoos Paul Zikopoulos
1st Edition
0071808183, 9780071808187