

Question
Use the data in the attached Excel sheet and complete the assignment detailed in the instructions below. 1. First, make sure you have the Data
Use the data in the attached Excel sheet and complete the assignment detailed in the instructions below.
1. First, make sure you have the Data Analysis Toolpak for Excel installed.
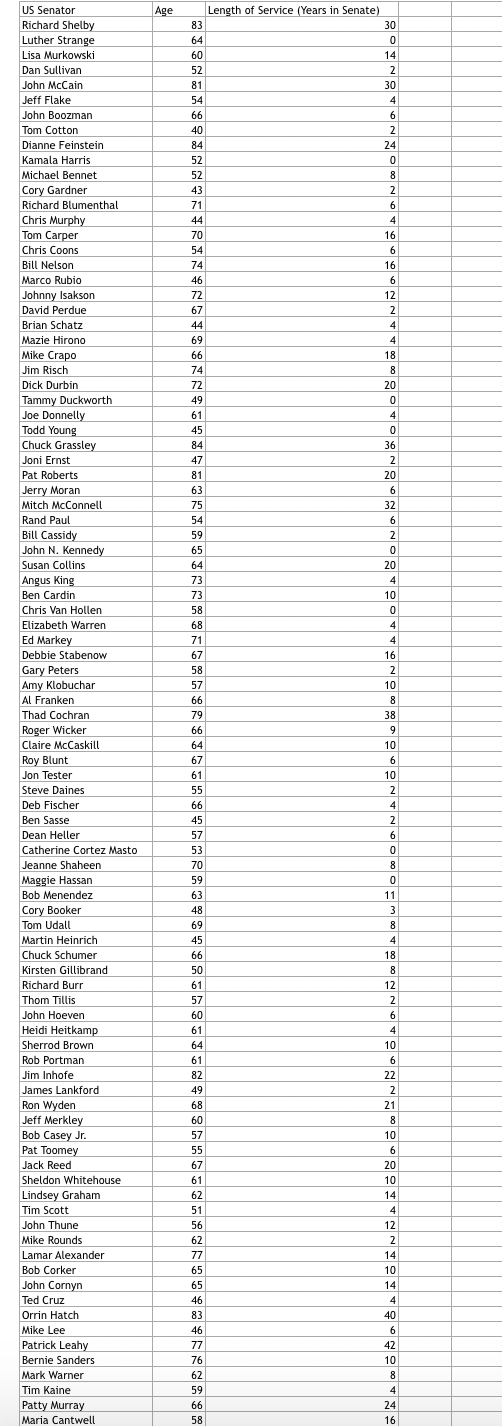
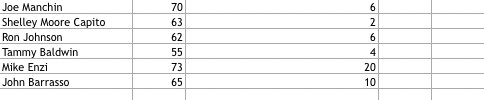
2. Open the Assignment 2 Excel sheet and examine the three variables listed. The variables are the names, age, and years of service of United States Senators from 2017. You will be analyzing the data for the two quantitative variables listed (Age and Years of Service). Again, note that you will not be analyzing anything regarding the categorical variable of personal name.
3. You should then decide on a BIN range and make a histogram for each quantitative variable that makes sense given the data. You can start by picking an interval range that seems reasonable and see how it works out. Look to your textbook section on frequency distributions and the corresponding PowerPoints to get additional suggestions on how to choose an appropriate interval range for each quantitative variable. Again, note you will be making a separate histogram for each quantitative variable listed in the sheet (i.e., two histograms total).
4. Calculate the descriptive statistics for each quantitative variable. Be sure to include the following.
- Measures of central tendency (for now, just do all three)
- A good measure of variability (use the standard deviation because it is themost useful of the measures covered in lecture)
- Calculate information related to the shape of the distribution (i.e., Skew and Kurt)
5. Write a report describing the results for each quantitative variable. You should report (in complete sentences, no bullet points or large tables) the measures you used, the results of the calculations, and what the numbers indicate. Be sure to report everything requested and nothing else.
- What were the mean, median, and mode for each quantitative variable? Which of these measures would best reflect the "typical" value for each distribution?
- What was the standard deviation?
- What about the shape of the distributions? Were the distributions relatively "normal"? Or, were they skewed? Were they mesokurtic, leptokurtic, or platykurtic? It is important that you report the numbers and your interpretation of what those numbers mean (e.g., if I reported a Skew value of -1.6, I would describe the distribution as being negatively skewed). Note that there are two distributions, which means that you will need to report results for each one.
- Be sure to include your histograms in the report. You are not to turn in an Excel sheet, only a Word document with the results, description of the results, and the histograms included.
Step by Step Solution
There are 3 Steps involved in it
Step: 1

Get Instant Access to Expert-Tailored Solutions
See step-by-step solutions with expert insights and AI powered tools for academic success
Step: 2

Step: 3
Ace Your Homework with AI
Get the answers you need in no time with our AI-driven, step-by-step assistance
Get Started
Finite Math And Applied Calculus
Authors: Stefan Waner, Steven Costenoble
7th Edition
1337515566, 9781337515566