Question
Use the data pasted at the last. Dates Xiaomi Share Price (LHS) Hang Seng Index (RHS) Jul-15-2018 19.88 28224.48 Jul-22-2018 19.04 28804.28 Jul-29-2018 17.00 27676.32
Use the data pasted at the last.

Dates Xiaomi Share Price (LHS) Hang Seng Index (RHS)
Jul-15-2018 19.88 28224.48 Jul-22-2018 19.04 28804.28 Jul-29-2018 17.00 27676.32 Aug-05-2018 18.16 28366.62 Aug-12-2018 16.36 27213.41 Aug-19-2018 17.04 27671.87 Aug-26-2018 16.80 27888.55 Sep-02-2018 16.50 26973.47 Sep-09-2018 16.68 27286.41 Sep-16-2018 16.76 27953.58 Sep-23-2018 15.50 27788.52 Sep-30-2018 14.28 26572.57 Oct-07-2018 13.06 25801.49 Oct-14-2018 12.28 25561.40 Oct-21-2018 12.28 24717.63 Oct-28-2018 13.48 26486.35 Nov-04-2018 13.20 25601.92 Nov-11-2018 12.94 26183.53 Nov-18-2018 14.44 25927.68 Nov-25-2018 14.28 26506.75 Dec-02-2018 13.64 26063.76 Dec-09-2018 13.54 26094.79 Dec-16-2018 13.68 25753.42 Dec-23-2018 12.94 25504.20 Dec-30-2018 11.96 25626.03 Jan-06-2019 10.34 26667.27 Jan-13-2019 10.16 27090.81 Jan-20-2019 10.10 27569.19 Jan-27-2019 10.44 27930.74 Feb-03-2019 10.26 27946.32 Feb-10-2019 11.14 27900.84 Feb-17-2019 11.92 28816.30 Feb-24-2019 11.88 28812.17 Mar-03-2019 11.74 28228.42 Mar-10-2019 11.58 29012.26 Mar-17-2019 11.28 29113.36 Mar-24-2019 11.38 29051.36 Mar-31-2019 11.84 29936.32 Apr-07-2019 11.62 29909.76 Apr-14-2019 11.70 29963.26 Apr-21-2019 12.02 29605.01 Apr-28-2019 11.80 30081.55 May-05-2019 10.64 28550.24 May-12-2019 10.16 27946.46 May-19-2019 9.77 27353.93 May-26-2019 9.58 26901.09 Jun-02-2019 9.21 26965.28 Jun-09-2019 9.55 27118.35 Jun-16-2019 9.80 28473.71 Jun-23-2019 10.00 28542.62 Jun-30-2019 9.95 28774.83 Jul-07-2019 9.44 28471.62 Jul-14-2019 9.11 28765.40 Jul-21-2019 9.12 28397.74 Jul-28-2019 8.80 26918.58 Aug-04-2019 8.94 25939.30 Aug-11-2019 8.92 25734.22 Aug-18-2019 8.96 26179.33 Aug-25-2019 8.53 25724.73 Sep-01-2019 9.08 26690.76 Sep-08-2019 9.48 27352.69 Sep-15-2019 9.25 26435.67 Sep-22-2019 8.70 25954.81 Sep-29-2019 8.95 25821.03 Oct-06-2019 8.88 26308.44 Oct-13-2019 8.55 26719.58 Oct-20-2019 9.06 26667.39 Oct-27-2019 8.96 27100.76 Nov-03-2019 8.84 27651.14 Nov-10-2019 8.51 26326.66 Nov-17-2019 8.39 26595.08 Nov-24-2019 8.95 26346.49 Dec-01-2019 9.34 26498.37 Dec-08-2019 10.40 27687.76 Dec-15-2019 10.34 27871.35 Dec-22-2019 10.80 28225.42 Dec-29-2019 10.90 28451.50 Jan-05-2020 11.42 28638.20 Jan-12-2020 13.24 29056.42 Jan-19-2020 13.34 27949.64 Jan-26-2020 11.52 26312.63 Feb-02-2020 12.84 27404.27 Feb-09-2020 13.10 27815.60 Feb-16-2020 12.72 27308.81 Feb-23-2020 12.56 26129.93 Mar-01-2020 12.98 26146.67 Mar-08-2020 10.98 24032.91 Mar-15-2020 10.16 22805.07 Mar-22-2020 10.20 23484.28 Mar-29-2020 10.26 23236.11 Apr-05-2020 10.14 24300.33 Apr-12-2020 10.40 24380.00 Apr-19-2020 10.00 23831.33 Apr-26-2020 10.20 24643.59 May-03-2020 11.20 24230.17 May-10-2020 11.96 23797.47 May-17-2020 11.86 22930.14 May-24-2020 12.02 22961.47 May-31-2020 13.02 24770.41 Jun-07-2020 12.80 24301.38 Jun-14-2020 12.90 24643.89 Jun-21-2020 13.32 24549.99 Jun-28-2020 14.26 25373.12 Jul-05-2020 16.88 25727.41 Jul-12-2020 15.50 25089.17 Jul-19-2020 15.10 24705.33 Jul-26-2020 14.82 24595.35 Aug-02-2020 15.44 24531.62 Aug-09-2020 15.34 25183.01 Aug-16-2020 18.16 25113.84 Aug-23-2020 22.50 25422.06 Aug-30-2020 24.50 24695.45 Sep-06-2020 23.25 24503.31 Sep-13-2020 22.05 24455.41 Sep-20-2020 19.72 23235.42 Sep-27-2020 20.45 23459.05 Oct-04-2020 20.95 24119.13 Oct-11-2020 23.15 24386.79 Oct-18-2020 21.85 24918.78 Oct-25-2020 22.00 24107.42 Nov-01-2020 25.10 25712.97 Nov-08-2020 24.25 26156.86 Nov-15-2020 25.55 26451.54 Nov-22-2020 26.05 26894.68 Nov-29-2020 25.35 26835.92 Dec-06-2020 27.55 26505.87 Dec-13-2020 28.80 26498.60 Dec-20-2020 32.45 26386.56 Dec-27-2020 33.20 27231.13 Jan-03-2021 31.95 27878.22 Jan-10-2021 29.30 28573.86 Jan-17-2021 29.80 29447.85 Jan-24-2021 29.20 28283.71 Jan-31-2021 27.20 29288.68 Feb-07-2021 28.05 30173.57 Feb-14-2021 30.65 30644.73 Feb-21-2021 25.30 28980.21 Feb-28-2021 24.45 29098.29 Mar-07-2021 22.75 28739.72 Mar-14-2021 26.25 28990.94 Mar-21-2021 25.40 28336.43 Mar-28-2021 26.45 28938.74 Apr-04-2021 25.70 28698.80 Apr-11-2021 26.05 28969.71 Apr-18-2021 27.05 29078.75 Apr-25-2021 24.60 28675.37 May-02-2021 25.25 28610.65
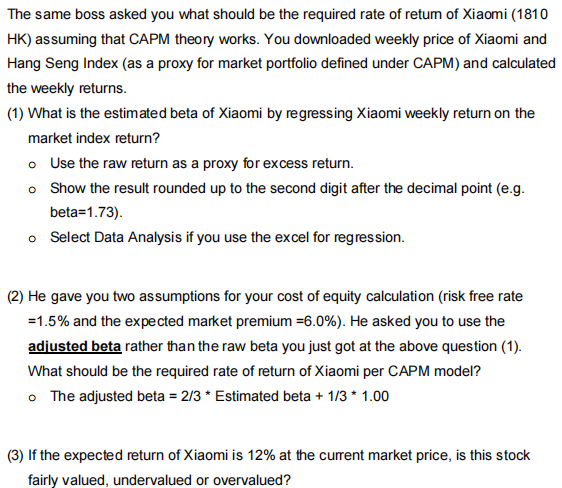
The same boss asked you what should be the required rate of retum of Xiaomi (1810 HK) assuming that CAPM theory works. You downloaded weekly price of Xiaomi and Hang Seng Index (as a proxy for market portfolio defined under CAPM) and calculated the weekly returns. (1) What is the estimated beta of Xiaomi by regressing Xiaomi weekly return on the market index return? o Use the raw return as a proxy for excess return. Show the result rounded up to the second digit after the decimal point (e.g. beta=1.73). Select Data Analysis if you use the excel for regression. (2) He gave you two assumptions for your cost of equity calculation (risk free rate =1.5% and the expected market premium -6.0%). He asked you to use the adjusted beta rather than the raw beta you just got at the above question (1). What should be the required rate of return of Xiaomi per CAPM model? o The adjusted beta = 2/3 * Estimated beta + 1/3 * 1.00 (3) If the expected return of Xiaomi is 12% at the current market price, is this stock fairly valued, undervalued or overvaluedStep by Step Solution
There are 3 Steps involved in it
Step: 1

Get Instant Access to Expert-Tailored Solutions
See step-by-step solutions with expert insights and AI powered tools for academic success
Step: 2

Step: 3

Ace Your Homework with AI
Get the answers you need in no time with our AI-driven, step-by-step assistance
Get Started


