

Question
Use the dependent variable (labeled Y) and one of the independent variables (labeled X1, X2, and X3) in the data file. Select and use one
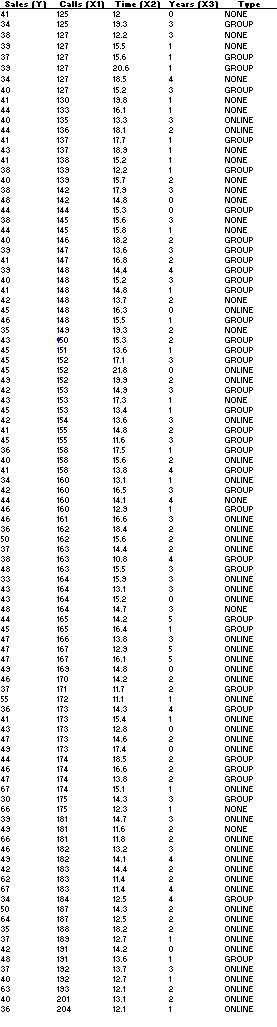
Use the dependent variable (labeled Y) and one of the independent variables (labeled X1, X2, and X3) in the data file. Select and use one independent variable throughout this analysis.
- Generate a scatterplot for the specified dependent variable (Y) and the selected independent variable (X), including the graph of the "best fit" line. Interpret.
- Determine the equation of the "best fit" line, which describes the relationship between the dependent variable and the selected independent variable.
- Determine the correlation coefficient. Interpret.
- Determine the coefficient of determination. Interpret.
- Test the utility of this regression model by completing a hypothesis test of b=0 using =0.10. Interpret results, including the p-value.
- Based on the findings in steps 1-5, analyze the ability of the independent variable to predict the dependent variable.
- Compute the confidence interval for b, using a 95% confidence level. Interpret this interval.
- Compute the 99% confidence interval for the dependent variable, for a selected value of the independent variable. Each student can choose a value to use for the independent variable (use the same value in the next step). Interpret this interval.
- Using the same chosen value for part (8), estimate the 99% prediction interval for the dependent variable. Interpret this interval.
- What can be said about the value of the dependent variable for values of the independent variable that are outside the range of the sample values? Explain.
- Describe a business decision that could be made based on the results of this analysis. In other words, how might the business operations change based on these statistical results?
Summarize your results from Steps 1-11 in a 3-page report. The report should explain and interpret the results in ways that are understandable to someone who does not know statistics.
Submission: The Word document, the summary report should be submitted for questions 1-11. The Excel output can be included as an appendix if needed.
Format for the report:
- Summary Report
- Steps 1-11 addressed with appropriate output, graphs, and interpretations. Be sure to number each step 1-11.
Sales (Y 122 2 15.6 13.8 1417 135 13.3 11.7 139 14 146 18.2 152 16.3 13.3 17.3 1306 116 34 13.1 160 Calls (X1) Time (X2) Years [X3) Type NONE GROUP NONE 15.5 NONE GROUP 20.6 GROUP 18.5 NONE GROUP NONE 16.1 NONE ONLINE ONLINE GROUP 18.9 NONE 138 NONE 12.2 GROUP NONE 142 17.9 NONE 142 NONE 15.3 GROUP 145 15.6 NONE 15.8 NONE GROUP GROUP 16.8 GROUP GROUP GROUP 14.8 GROUP 13.7 NONE ONLINE 148 15.5 GROUP NONE GROUP 13.6 GROUP GROUP 218 ONLINE 19.9 ONLINE GROUP NONE GROUP ONLINE 155 GROUP GROUP GROUP 15.6 ONLINE GROUP 160 ONLINE 16.5 GROUP NONE 160 12.9 GROUP ONLINE ONLINE ONLINE 163 ONLINE GROUP 163 GROUP ONLINE ONLINE ONLINE 164 14.7 NONE 14.2 GROUP 165 GROUP 166 ONLINE ONLINE 167 ONLINE ONLINE 14.2 ONLINE GROUP 172 ONLINE GROUP 15.4 ONLINE 173 ONLINE ONLINE 173 17.4 ONLINE 18.5 GROUP GROUP 174 GROUP ONLINE 14.3 12.3 NONE 181 14.7 ONLINE NONE ONLINE 182 13.2 ONLINE 182 14.1 ONLINE ONLINE 183 11.4 ONLINE ONLINE 125 GROUP 14.3 ONLINE ONLINE ONLINE ONLINE 191 14.2 ONLINE 191 GROUP ONLINE 192 ONLINE ONLINE ONLINE ONLINE 46 161 16.6 16.4 15.6 14.4 50 37 38 48 10.8 15.5 15.9 13.1 15.2 164 45 47 16.4 13.8 167 - NONNONONOVO UOMO ANNO 49 169 16.1 14.8 170 T1 11.1 36 14.3 43 12.8 146 173 44 174 178 16.6 13.8 67 15.1 175 GROUP 115 66 39 181 11.6 11.8 66 46 101 42 183 14.4 62 67 183 114 184 187 18T 125 18.2 158 189 13,6 192 13.7 NO Sales (Y 122 2 15.6 13.8 1417 135 13.3 11.7 139 14 146 18.2 152 16.3 13.3 17.3 1306 116 34 13.1 160 Calls (X1) Time (X2) Years [X3) Type NONE GROUP NONE 15.5 NONE GROUP 20.6 GROUP 18.5 NONE GROUP NONE 16.1 NONE ONLINE ONLINE GROUP 18.9 NONE 138 NONE 12.2 GROUP NONE 142 17.9 NONE 142 NONE 15.3 GROUP 145 15.6 NONE 15.8 NONE GROUP GROUP 16.8 GROUP GROUP GROUP 14.8 GROUP 13.7 NONE ONLINE 148 15.5 GROUP NONE GROUP 13.6 GROUP GROUP 218 ONLINE 19.9 ONLINE GROUP NONE GROUP ONLINE 155 GROUP GROUP GROUP 15.6 ONLINE GROUP 160 ONLINE 16.5 GROUP NONE 160 12.9 GROUP ONLINE ONLINE ONLINE 163 ONLINE GROUP 163 GROUP ONLINE ONLINE ONLINE 164 14.7 NONE 14.2 GROUP 165 GROUP 166 ONLINE ONLINE 167 ONLINE ONLINE 14.2 ONLINE GROUP 172 ONLINE GROUP 15.4 ONLINE 173 ONLINE ONLINE 173 17.4 ONLINE 18.5 GROUP GROUP 174 GROUP ONLINE 14.3 12.3 NONE 181 14.7 ONLINE NONE ONLINE 182 13.2 ONLINE 182 14.1 ONLINE ONLINE 183 11.4 ONLINE ONLINE 125 GROUP 14.3 ONLINE ONLINE ONLINE ONLINE 191 14.2 ONLINE 191 GROUP ONLINE 192 ONLINE ONLINE ONLINE ONLINE 46 161 16.6 16.4 15.6 14.4 50 37 38 48 10.8 15.5 15.9 13.1 15.2 164 45 47 16.4 13.8 167 - NONNONONOVO UOMO ANNO 49 169 16.1 14.8 170 T1 11.1 36 14.3 43 12.8 146 173 44 174 178 16.6 13.8 67 15.1 175 GROUP 115 66 39 181 11.6 11.8 66 46 101 42 183 14.4 62 67 183 114 184 187 18T 125 18.2 158 189 13,6 192 13.7 NO
Step by Step Solution
There are 3 Steps involved in it
Step: 1

Get Instant Access to Expert-Tailored Solutions
See step-by-step solutions with expert insights and AI powered tools for academic success
Step: 2

Step: 3
Ace Your Homework with AI
Get the answers you need in no time with our AI-driven, step-by-step assistance
Get Started
Accounting For Investments Equities Futures And Options Volume 1
Authors: R. Venkata Subramani
1st Edition
047082431X, 978-0470824313