Answered step by step
Verified Expert Solution
Link Copied!

Question

1 Approved Answer

Use the deseasonalized trendline from the graph to predict the sales for time period 30. The seasonal factor for this time period is 104. Deseasonalized
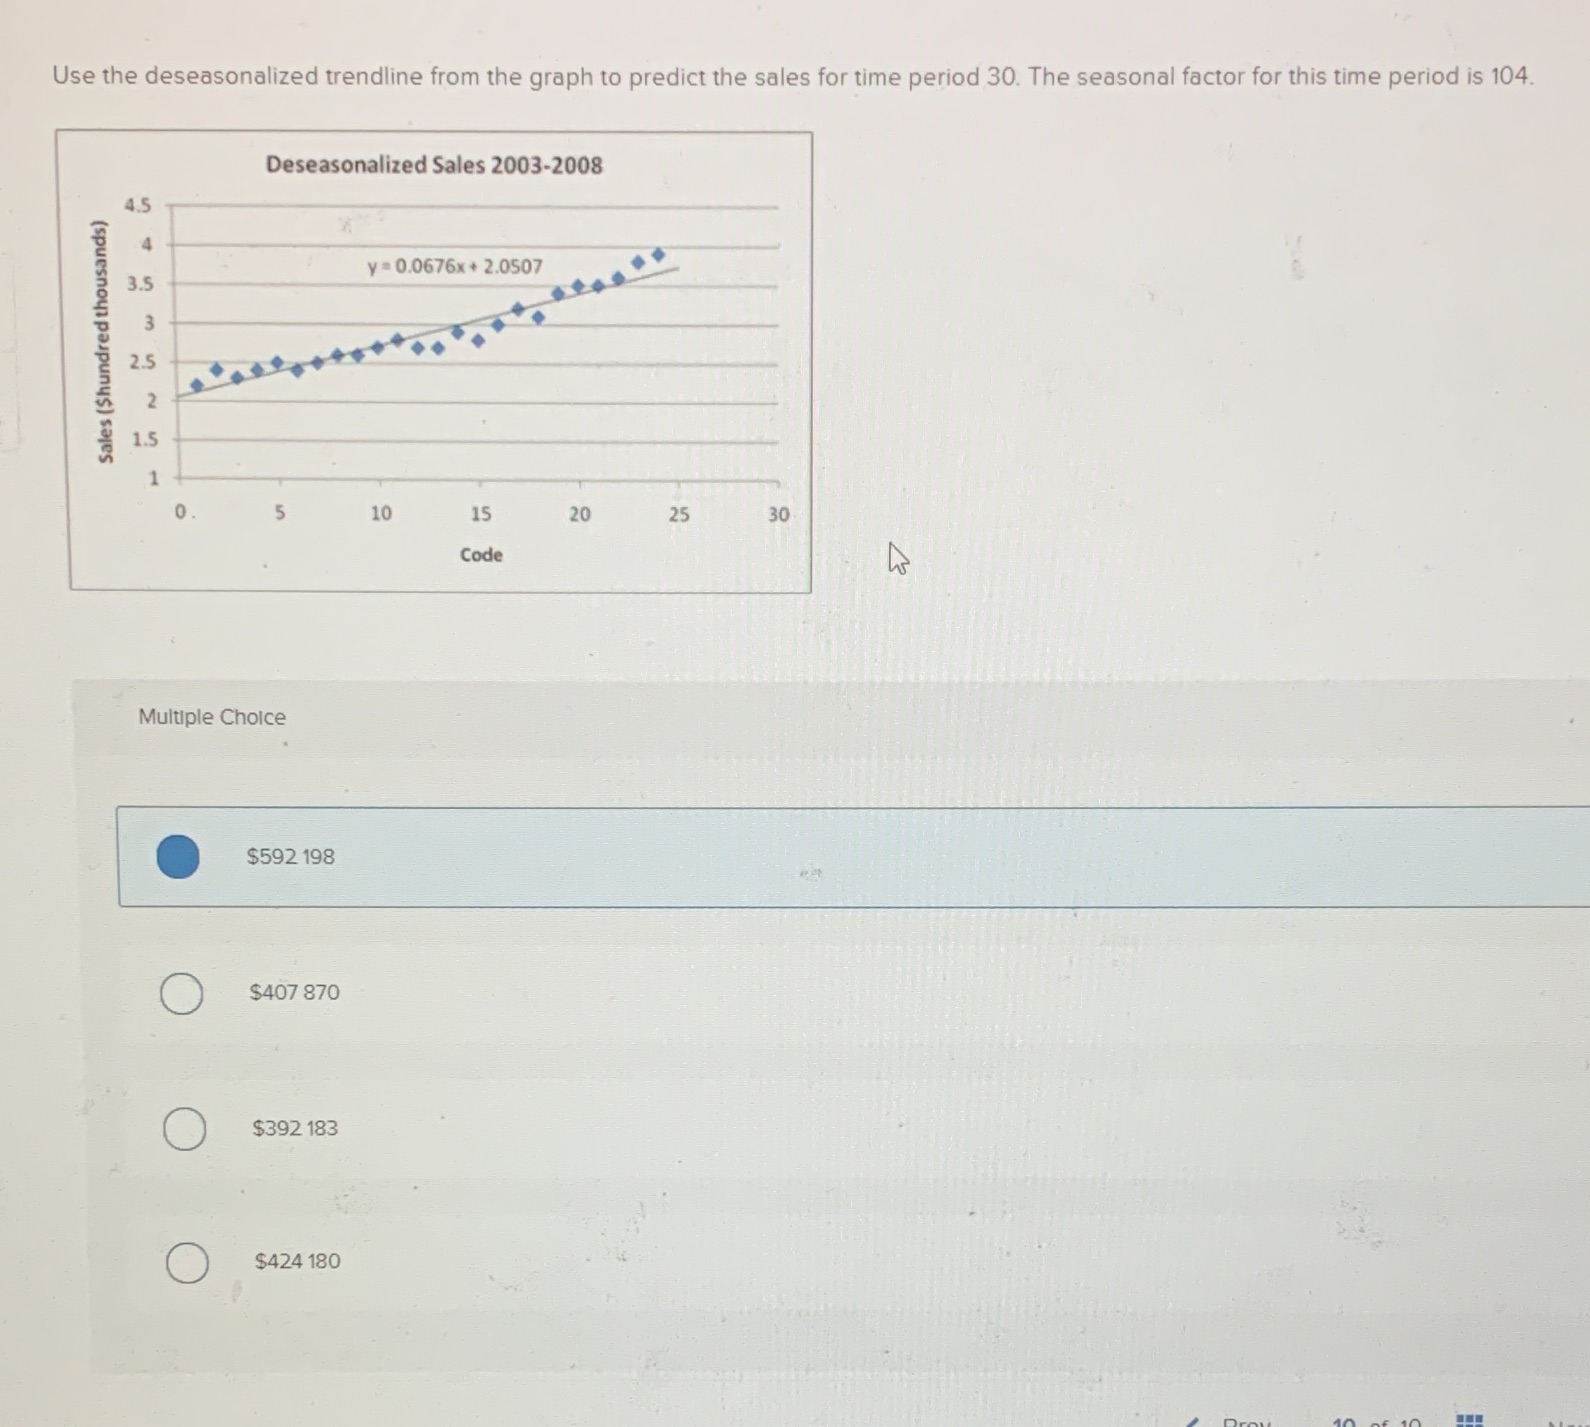
image text in transcribed
Use the deseasonalized trendline from the graph to predict the sales for time period 30. The seasonal factor for this time period is 104. Deseasonalized Sales 2003-2008 4.5 y = 0.0676x + 2.0507 3.5 in w Sales ($hundred thousands) N O 5 10 15 20 25 30 Code Multiple Choice $592 198 O $407 870 $392 183 $424 180

Step by Step Solution

There are 3 Steps involved in it

Step: 1

blur-text-image

Get Instant Access to Expert-Tailored Solutions

See step-by-step solutions with expert insights and AI powered tools for academic success

Step: 2

blur-text-image_2

Step: 3

blur-text-image_3

Ace Your Homework with AI

Get the answers you need in no time with our AI-driven, step-by-step assistance

Get Started

Recommended Textbook for

Big Ideas MATH Algebra 2

Authors: Ron Larson, Laurie Boswell

Common Core Curriculum

160840840X, 978-1608408405

More Books

Students also viewed these Mathematics questions

Question

The Unicef was awarded the Nobel peace prize in the year........?

Answered: 1 week ago

Question

Who heads the council of ministers?

Answered: 1 week ago

Question

Who Coined and used the ward non aligned first?

Answered: 1 week ago

Question

Formation of forward bloc by subha bose was .....?

Answered: 1 week ago