

Answered step by step
Verified Expert Solution
Question
1 Approved Answer
Use the domestic supply and demand curves for minerals (tons) in Dune and Pern at the end of this homework. Make sure you properly label
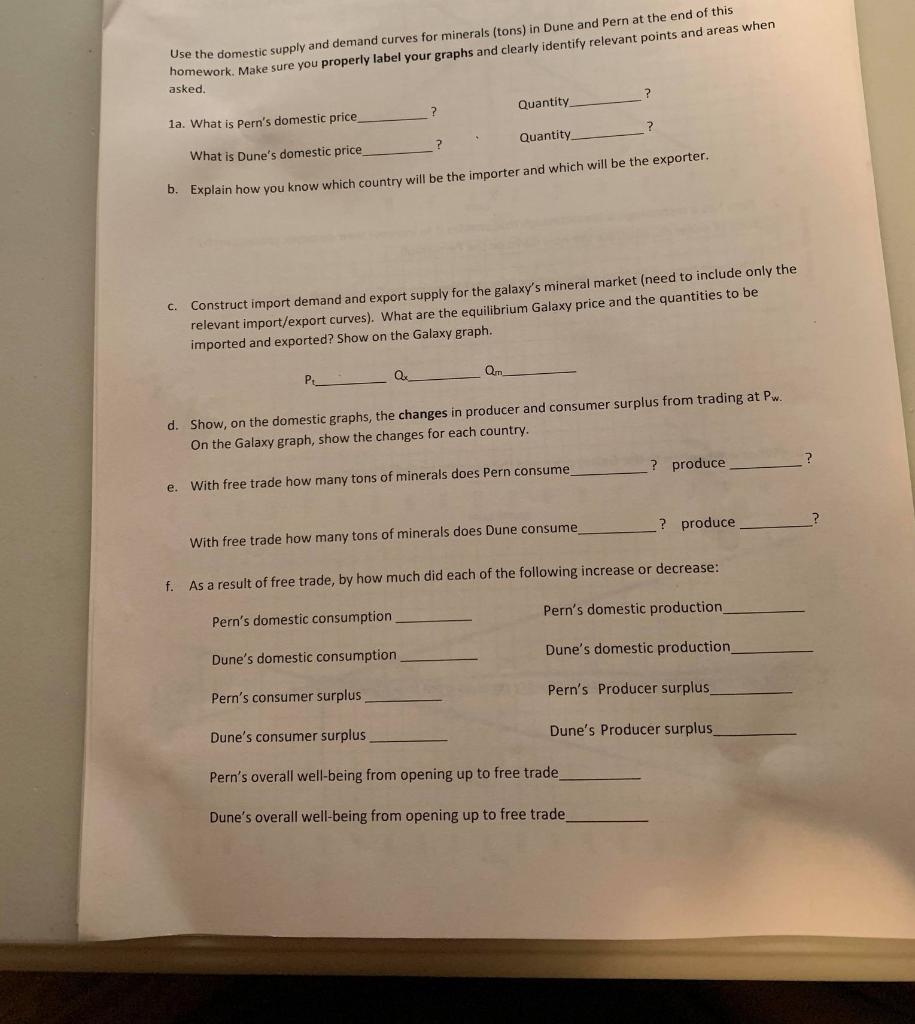
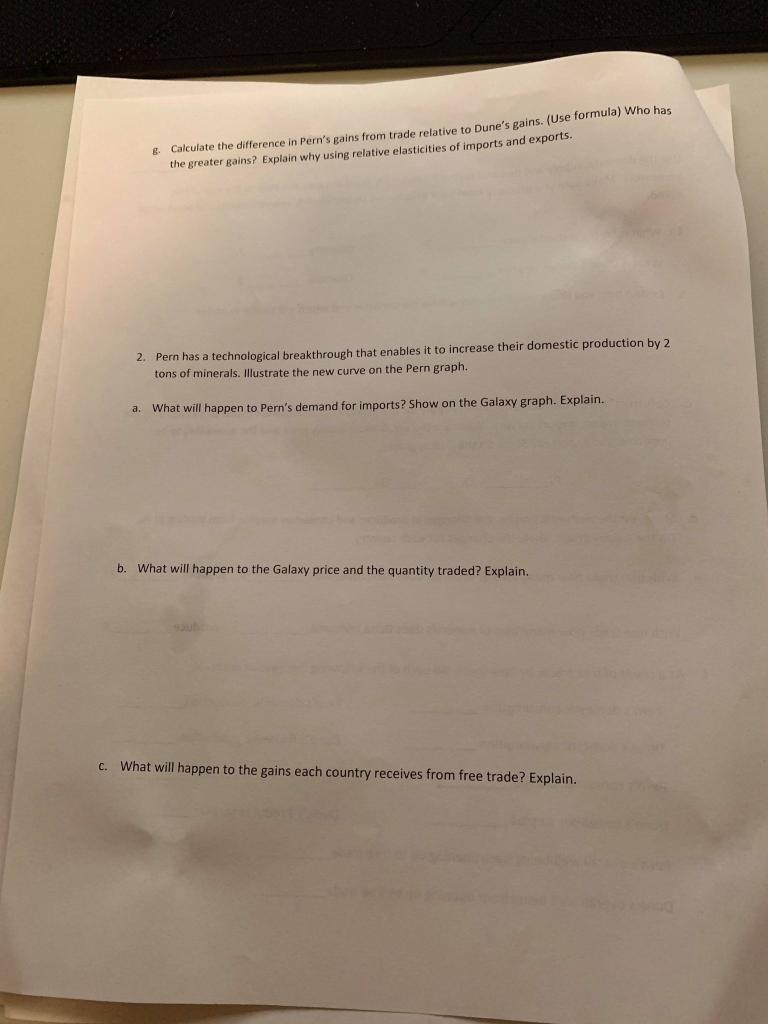
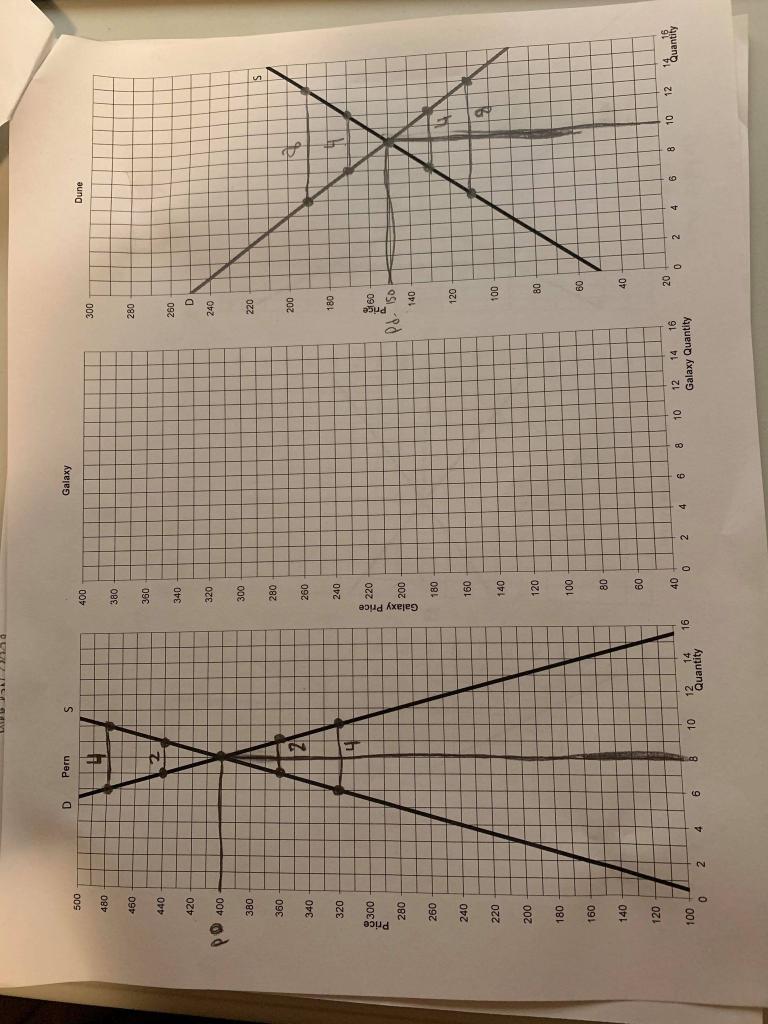
Use the domestic supply and demand curves for minerals (tons) in Dune and Pern at the end of this homework. Make sure you properly label your graphs and clearly identify relevant points and areas when asked. ? Quantity la. What is Pern's domestic price ? Quantity What is Dune's domestic price b. Explain how you know which country will be the importer and which will be the exporter. Construct import demand and export supply for the galaxy's mineral market (need to include only the relevant import/export curves). What are the equilibrium Galaxy price and the quantities to be imported and exported? Show on the Galaxy graph. Qm d. Show, on the domestic graphs, the changes in producer and consumer surplus from trading at Pw. On the Galaxy graph, show the changes for each country. ? produce e. With free trade how many tons of minerals does Pern consume ? produce ? With free trade how many tons of minerals does Dune consume f. As a result of free trade, by how much did each of the following increase or decrease: Pern's domestic production Pern's domestic consumption Dune's domestic consumption Dune's domestic production Pern's consumer surplus Pern's Producer surplus Dune's consumer surplus Dune's Producer surplus Pern's overall well-being from opening up to free trade Dune's overall well-being from opening up to free trade g Calculate the difference in Pern's gains from trade relative to Dune's gains. (Use formula) Who has the greater gains? Explain why using relative elasticities of imports and exports. 2. Pern has a technological breakthrough that enables it to increase their domestic production by 2 tons of minerals. Illustrate the new curve on the Pern graph. a. What will happen to Pern's demand for imports? Show on the Galaxy graph. Explain. b. What will happen to the Galaxy price and the quantity traded? Explain. c. What will happen to the gains each country receives from free trade? Explain. Price 2 4 1 + Pern N N3 Quantity Galaxy Price 8 O N Galaxy Galaxy Quantity 4 16 PO Price ne 20 8 & + N A OP o N Use the domestic supply and demand curves for minerals (tons) in Dune and Pern at the end of this homework. Make sure you properly label your graphs and clearly identify relevant points and areas when asked. ? Quantity la. What is Pern's domestic price ? Quantity What is Dune's domestic price b. Explain how you know which country will be the importer and which will be the exporter. Construct import demand and export supply for the galaxy's mineral market (need to include only the relevant import/export curves). What are the equilibrium Galaxy price and the quantities to be imported and exported? Show on the Galaxy graph. Qm d. Show, on the domestic graphs, the changes in producer and consumer surplus from trading at Pw. On the Galaxy graph, show the changes for each country. ? produce e. With free trade how many tons of minerals does Pern consume ? produce ? With free trade how many tons of minerals does Dune consume f. As a result of free trade, by how much did each of the following increase or decrease: Pern's domestic production Pern's domestic consumption Dune's domestic consumption Dune's domestic production Pern's consumer surplus Pern's Producer surplus Dune's consumer surplus Dune's Producer surplus Pern's overall well-being from opening up to free trade Dune's overall well-being from opening up to free trade g Calculate the difference in Pern's gains from trade relative to Dune's gains. (Use formula) Who has the greater gains? Explain why using relative elasticities of imports and exports. 2. Pern has a technological breakthrough that enables it to increase their domestic production by 2 tons of minerals. Illustrate the new curve on the Pern graph. a. What will happen to Pern's demand for imports? Show on the Galaxy graph. Explain. b. What will happen to the Galaxy price and the quantity traded? Explain. c. What will happen to the gains each country receives from free trade? Explain. Price 2 4 1 + Pern N N3 Quantity Galaxy Price 8 O N Galaxy Galaxy Quantity 4 16 PO Price ne 20 8 & + N A OP o N
Step by Step Solution
There are 3 Steps involved in it
Step: 1

Get Instant Access to Expert-Tailored Solutions
See step-by-step solutions with expert insights and AI powered tools for academic success
Step: 2

Step: 3
Ace Your Homework with AI
Get the answers you need in no time with our AI-driven, step-by-step assistance
Get Started
Guide To Conducting Internal Audits Of Your Management Systems
Authors: Martin Pykett
1st Edition
B099C3GPMH, 979-8538997749