Answered step by step
Verified Expert Solution
Link Copied!

Question

1 Approved Answer

Use the Edit menu in your browser to copy the 1000 numbers obtained in the coin tossing experiments. (d) Go back to LinuStats and choose

Use the Edit menu in your browser to copy the 1000 numbers obtained

in the coin tossing experiments.

(d) Go back to LinuStats and choose the descriptive statistics page.

(e) Use the Edit menu in your browser to paste the 1000 numbers into the

data window.

(f) Choose a minimum value of 0, maximum value of 1, and window of

0.1

(g) Analyze the data by clicking the appropriate button.

(h) Copy the resulting relative frequency table and transform it into a cumulative distribution function

(i) Copy the Mean and SD (Standard Deviation) of the 1000 numbers.

Explain what this standard deviation means. I'll call these numbers

X and ?X

(j) Compare the obtained cumulative distribution function with that predicted by a Gaussian distribution with mean X and standard deviation

?X

Suppose that you take a random sample of 10,000 Americans and find that

1,111 are left- handed. You perform a test of significance to assess whether the

sample data provide evidence that more than 10% of all Americans are lefthanded, and you calculate a test statistic of 3.70 and a p-value of .0001.

Furthermore, you calculate a 99% confidence interval for the proportion of lefthanders in America to be (.103,.119). Consider the following statements: The

sample provides strong evidence that more than 10% of all Americans are lefthanded. The sample provides evidence that the proportion of left-handers in

America is much larger than 10%. Which of these two statements is the more

appropriate conclusion to draw? Explain your answer based on the results of

the significance test and confidence interval.

36. A student wanted to study the ages of couples applying for marriage licenses in

his county. He studied a sample of 94 marriage licenses and found that in 67

cases the husband was older than the wife. Do the sample data provide strong

evidence that the husband is usually older than the wife among couples

image text in transcribedimage text in transcribedimage text in transcribedimage text in transcribed
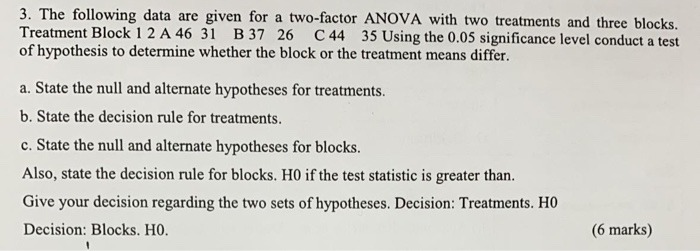
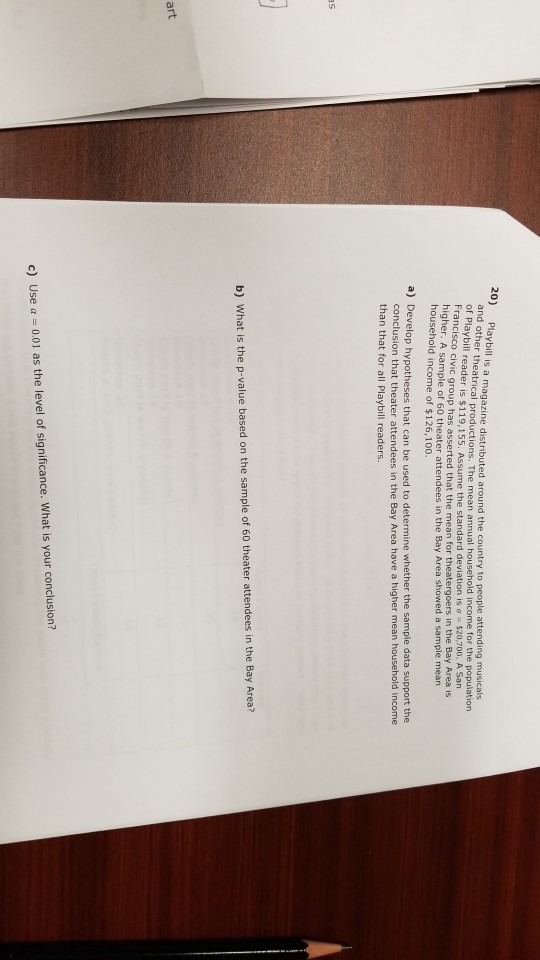
1. Suppose data is distributed according to the PosNeg Distribution described as follows: X and Y are uniform random variables on [-1,1]. If X*Y > 0, Class=P Else Class=N You can answer the questions from the denitions of the data, but sample data is provided on Canvas in case you want to check your answers Assume that the boundary points for binning will be chosen optimally. a. What is the best possible rule that OneR could generate? Why? b. What is the best possible rule that J48 could generate? Why? c. Naive Bayes (either discrete or continuous)? Why? Determine whether the following variables are discrete or continuous. Type your answer in the box. a. The ounces of coffee in a cup of coffee at Starbucks. continous b. The temperature in Salem at 12 a.m. on December 25th. descrete c. The length of time it takes a singer to sing "America The Beautiful". d. The number of bricks used to build the buildings at Chemeketa.3. The following data are given for a two-factor ANOVA with two treatments and three blocks. Treatment Block 1 2 A 46 31 B 37 26 C 44 35 Using the 0.05 significance level conduct a test of hypothesis to determine whether the block or the treatment means differ. a. State the null and alternate hypotheses for treatments. b. State the decision rule for treatments. c. State the null and alternate hypotheses for blocks. Also, state the decision rule for blocks. HO if the test statistic is greater than. Give your decision regarding the two sets of hypotheses. Decision: Treatments. HO Decision: Blocks. HO. (6 marks)20) Playbill is a magazine distributed around the country to people attending musicals and other theatrical productions. The mean annual household income for the population of Playbill reader is $119,155. Assume the standard deviation is a = $20,700, A San Francisco civic group has asserted that the mean for theatergoers in the Bay Area is higher. A sample of 60 theater attendees in the Bay Area showed a sample mean household income of $126,100. a) Develop hypotheses that can be used to determine whether the sample data support the conclusion that theater attendees in the Bay Area have a higher mean household income than that for all Playbill readers. b) What is the p-value based on the sample of 60 theater attendees in the Bay Area? art c) Use a = 0.01 as the level of significance. What is your conclusion

Step by Step Solution

There are 3 Steps involved in it

Step: 1

blur-text-image

Get Instant Access to Expert-Tailored Solutions

See step-by-step solutions with expert insights and AI powered tools for academic success

Step: 2

blur-text-image

Step: 3

blur-text-image

Ace Your Homework with AI

Get the answers you need in no time with our AI-driven, step-by-step assistance

Get Started

Recommended Textbook for

Finite Mathematics

Authors: Stefan Waner, Jerry Lee Ford Jr, Waner/Costenoble, Steven Costenoble

5th Edition

1111789304, 9781111789305

More Books

Students also viewed these Mathematics questions